Monitoring is often critical in enterprise-level applications. Monitoring can help us prevent failures, predict trends, alert when thresholds are reached, and provide more information to troubleshoot production problems. If we don’t know how our program is running, it will take more time to troubleshoot when there is an accident in the online system. If we can monitor in advance, we can prepare early so that we don’t get confused after an accident, but of course we can’t avoid the system from not generating a little accident, but we can reduce the number of system accidents. At the same time can also see the system problems, early optimization, to avoid greater accidents.
1. Spring Boot Actuator
According to the official website, Spring Boot includes a lot of additional features to help us monitor and manage our applications, either using HTTP or JMX, etc. to get the health status of the application and other metrics collected through the endpoint.
The Spring Boot Actuator module is a Spring Boot integration that provides the monitoring and management features described above. It is easy to use out of the box like other Spring Boot modules and can be used to monitor our application using HTTP or JMX through the Actuator.
JMX (Java Management Extensions): Management and monitoring interface for the Java platform, any program that accesses this interface according to the JMX specification can get all the management and monitoring information.
Here is a brief description of how the Spring Boot Actuator is used, see official documentation for details, the official documentation is always worth trusting.
1.1 Adding dependencies
Maven.
Gradle.
1.2 Enabling endpoints
Spring Boot provides a number of native endpoints, such as health, to help us monitor the monitoring status (availability) of the application, and to add custom endpoints. Each endpoint can be individually set to be enabled or not and exposed to external systems via HTTP or JMX. If the HTTP method is chosen, the URL is typically prefixed with /actuator, for example the url address for health is /actuator/health.
By default, all endpoints are turned on by default, except shutdown (which allows the system to shut down gracefully). We can set the state of a port with management.endpoint.<id>.enabled, for example to enable the shutdown port.
|
|
1.3 Exposing endpoints
After opening the endpoint you must also expose the endpoint to HTTP or JMX to use it properly, but the port may contain some sensitive data, so Spring Boot’s native ports only support HTTP or JMX by default, for example, the shutdown port only supports JMX by default, and the health port supports JMX as well as HTTP.
| ID | JMX | Web |
|---|---|---|
auditevents |
Yes | No |
beans |
Yes | No |
caches |
Yes | No |
conditions |
Yes | No |
configprops |
Yes | No |
env |
Yes | No |
flyway |
Yes | No |
health |
Yes | Yes |
heapdump |
N/A | No |
httptrace |
Yes | No |
info |
Yes | No |
integrationgraph |
Yes | No |
jolokia |
N/A | No |
logfile |
N/A | No |
loggers |
Yes | No |
liquibase |
Yes | No |
metrics |
Yes | No |
mappings |
Yes | No |
prometheus |
N/A | No |
quartz |
Yes | No |
scheduledtasks |
Yes | No |
sessions |
Yes | No |
shutdown |
Yes | No |
startup |
Yes | No |
threaddump |
Yes | No |
To change how the port is exposed, use the include or exclude attribute, for example.
So far, Spring Boot Actuator is configured, in addition to the endpoints seen above to open and expose the way, there are HTTP, JMX, logging, metrics (Metrics), permissions, HTTP tracking, process monitoring and other features, if you want to know more, you can go to official website for further study.
2. Prometheus
Prometheus, Chinese name Prometheus, is a new generation of monitoring system, compared with other monitoring systems, has many features such as easy management, monitoring the internal operation status of services, powerful data model, powerful query language PromQL, efficient, scalable, easy integration, visualization, openness, etc. Details can be found on the official website and will not be described in detail here.
In Spring Boot, the prometheus port is natively supported, and it is only necessary to integrate Prometheus exposure to HTTP by the following configuration.
In addition to the above configuration, you also need to configure metrics, because without this parameter, many reports cannot be displayed properly. (No in-depth study here, sorry…) .
This will configure the Prometheus client, in addition to the server side, where we use the docker method, first need the configuration file prometheus.yml.
Create docker-compose.yml and note the relative paths of prometheus.yml and docker-compose.yml, if they are in the same directory, the volumes are - '. /prometheus.yml:/etc/prometheus/config.yml' .
Then you can start it directly with the command docker-compose up -d, and use docker compose separately, so I won’t go into details here.
Once started, visit http://localhost:9090 in your browser.
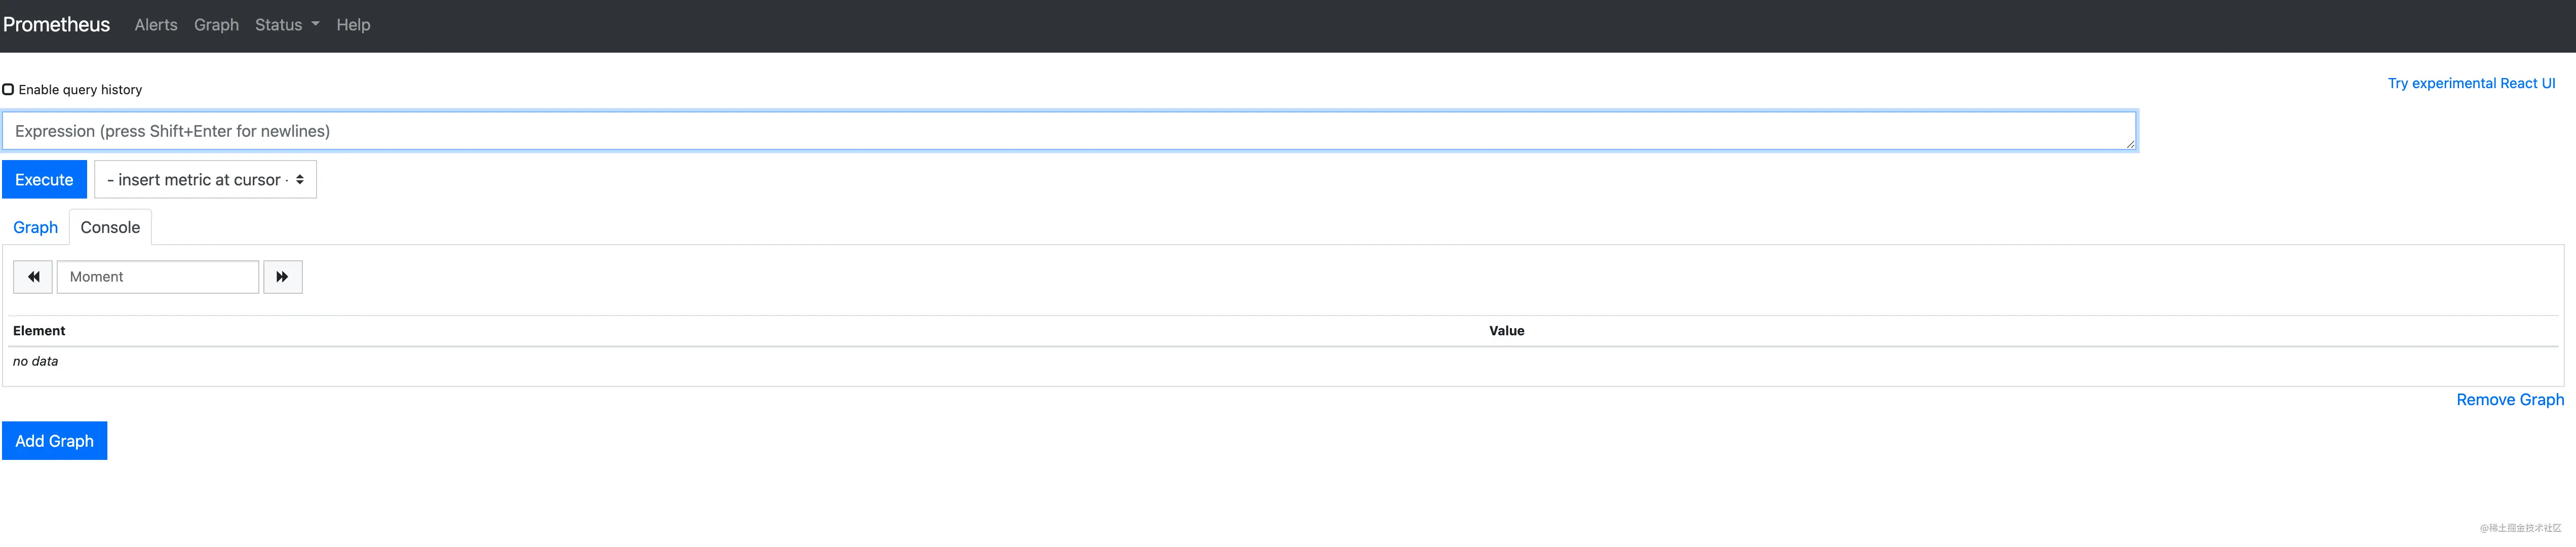
Then, you can view the monitoring data for different metrics, such as jvm_memory_used_bytes.
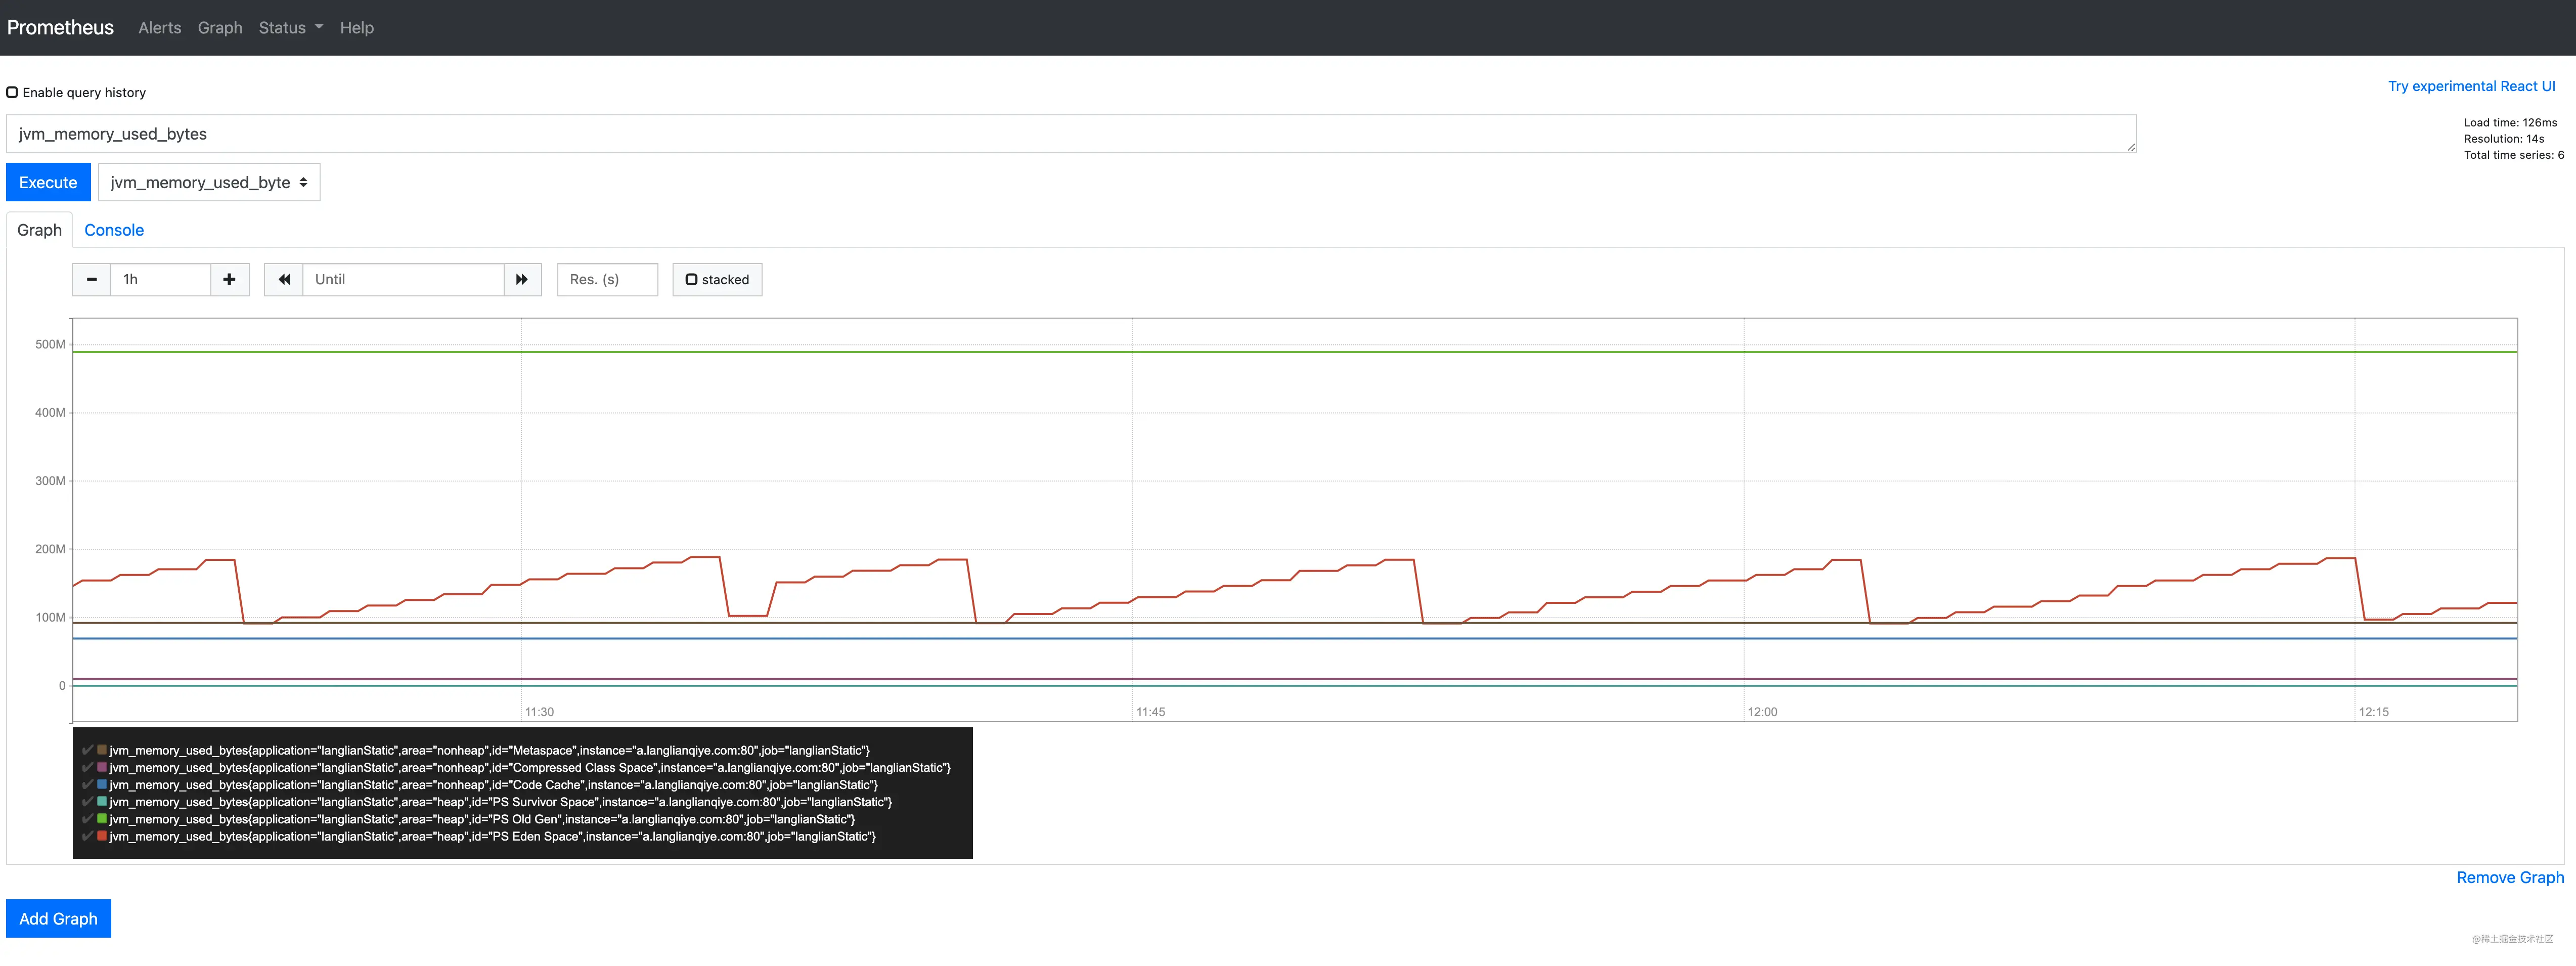
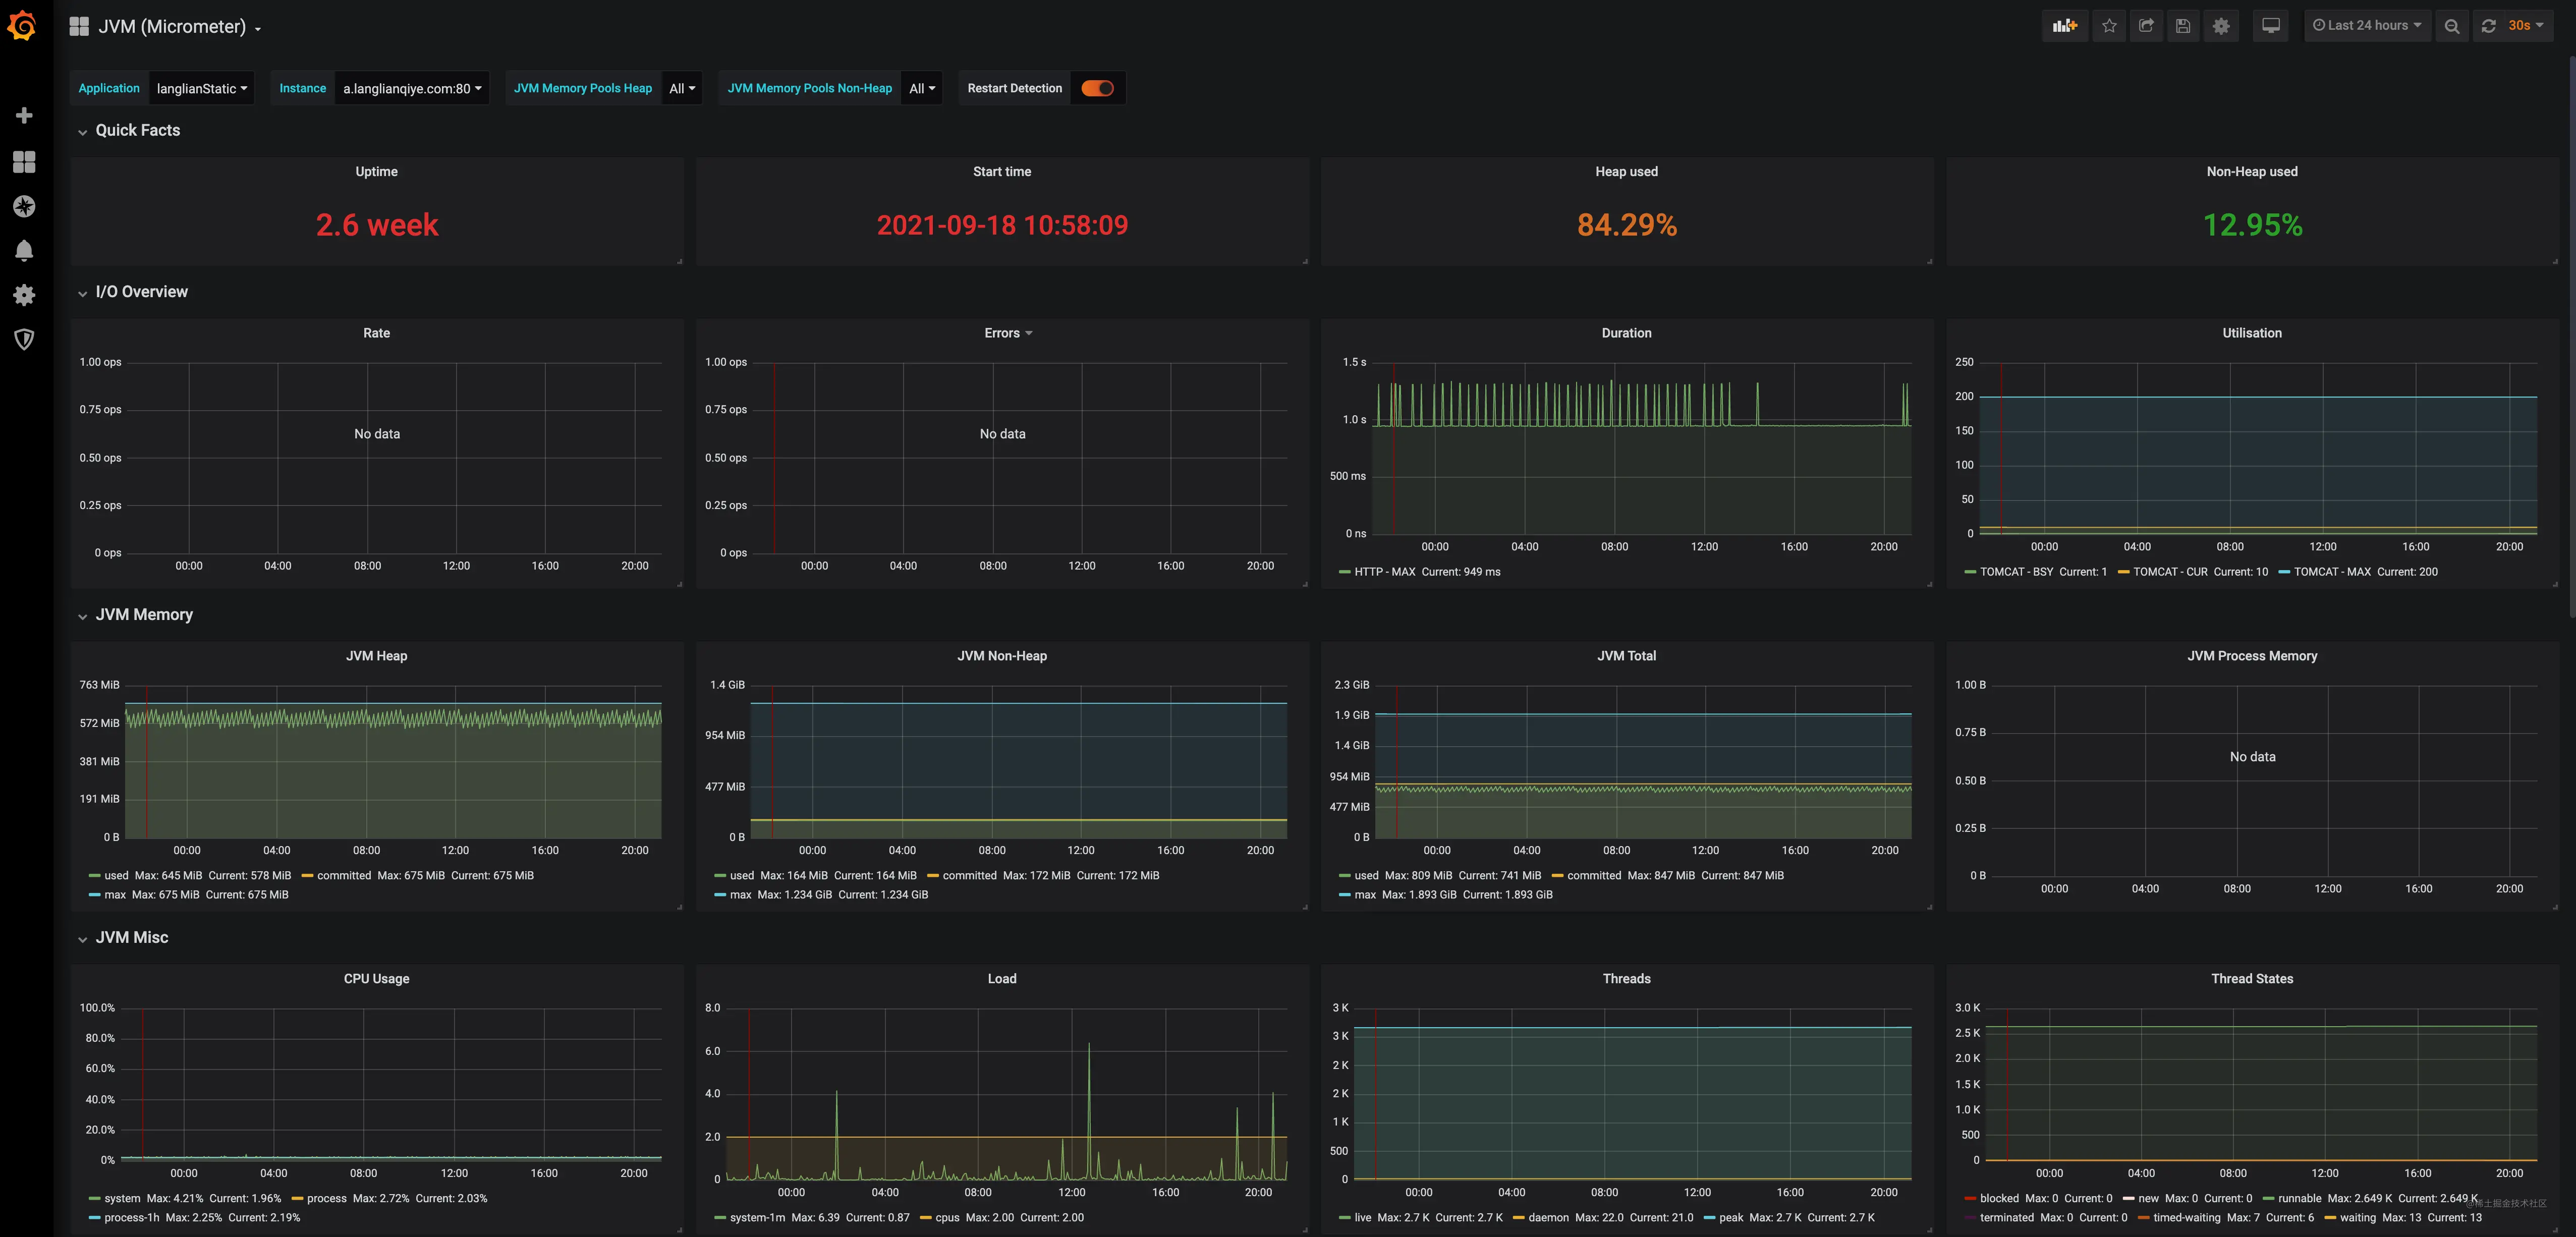
In this way, we can already see the monitoring data of different metrics of Spring Boot through Prometheus, so why do we still need Grafana? It is possible not to integrate Grafana, but through Grafana, we can visualize the monitoring data more easily and quickly, and the final result is described in the figure below.
If interested, continue reading below.
3. Grafana
3.1 Introduction
Grafana is a visual panel that displays very nice icons and layouts and supports Prometheus, SQL (MySQL, PostgreSQL), etc. as data sources.
It has the following features.
- visualization: very nice variety of components to choose from, such as charts, text, reminders, and a flexible layout to freely configure your visualization panel.
- Data Sources: Currently supports various data sources such as Prometheus, Graphite, Loki, Elasticsearch, MySQL, PostgreSQL, Stackdriver and TestData DB.
- Notification Alert: Configure notification rules visually and send the configured message to the designated administrator when the data reaches the threshold value.
- Mixed Data Sources: Mix different data sources in the same graph and specify data sources based on each query.
3.2 Installation
Still using docker compose, docker-compose.yml is as follows.
This can be combined with Prometheus in a docker compose, configured as follows.
Then start it again with the command docker-compose up -d, access http://localhost:3000 in your browser and log in with the initial account admin:admin.
3.3 Configuration
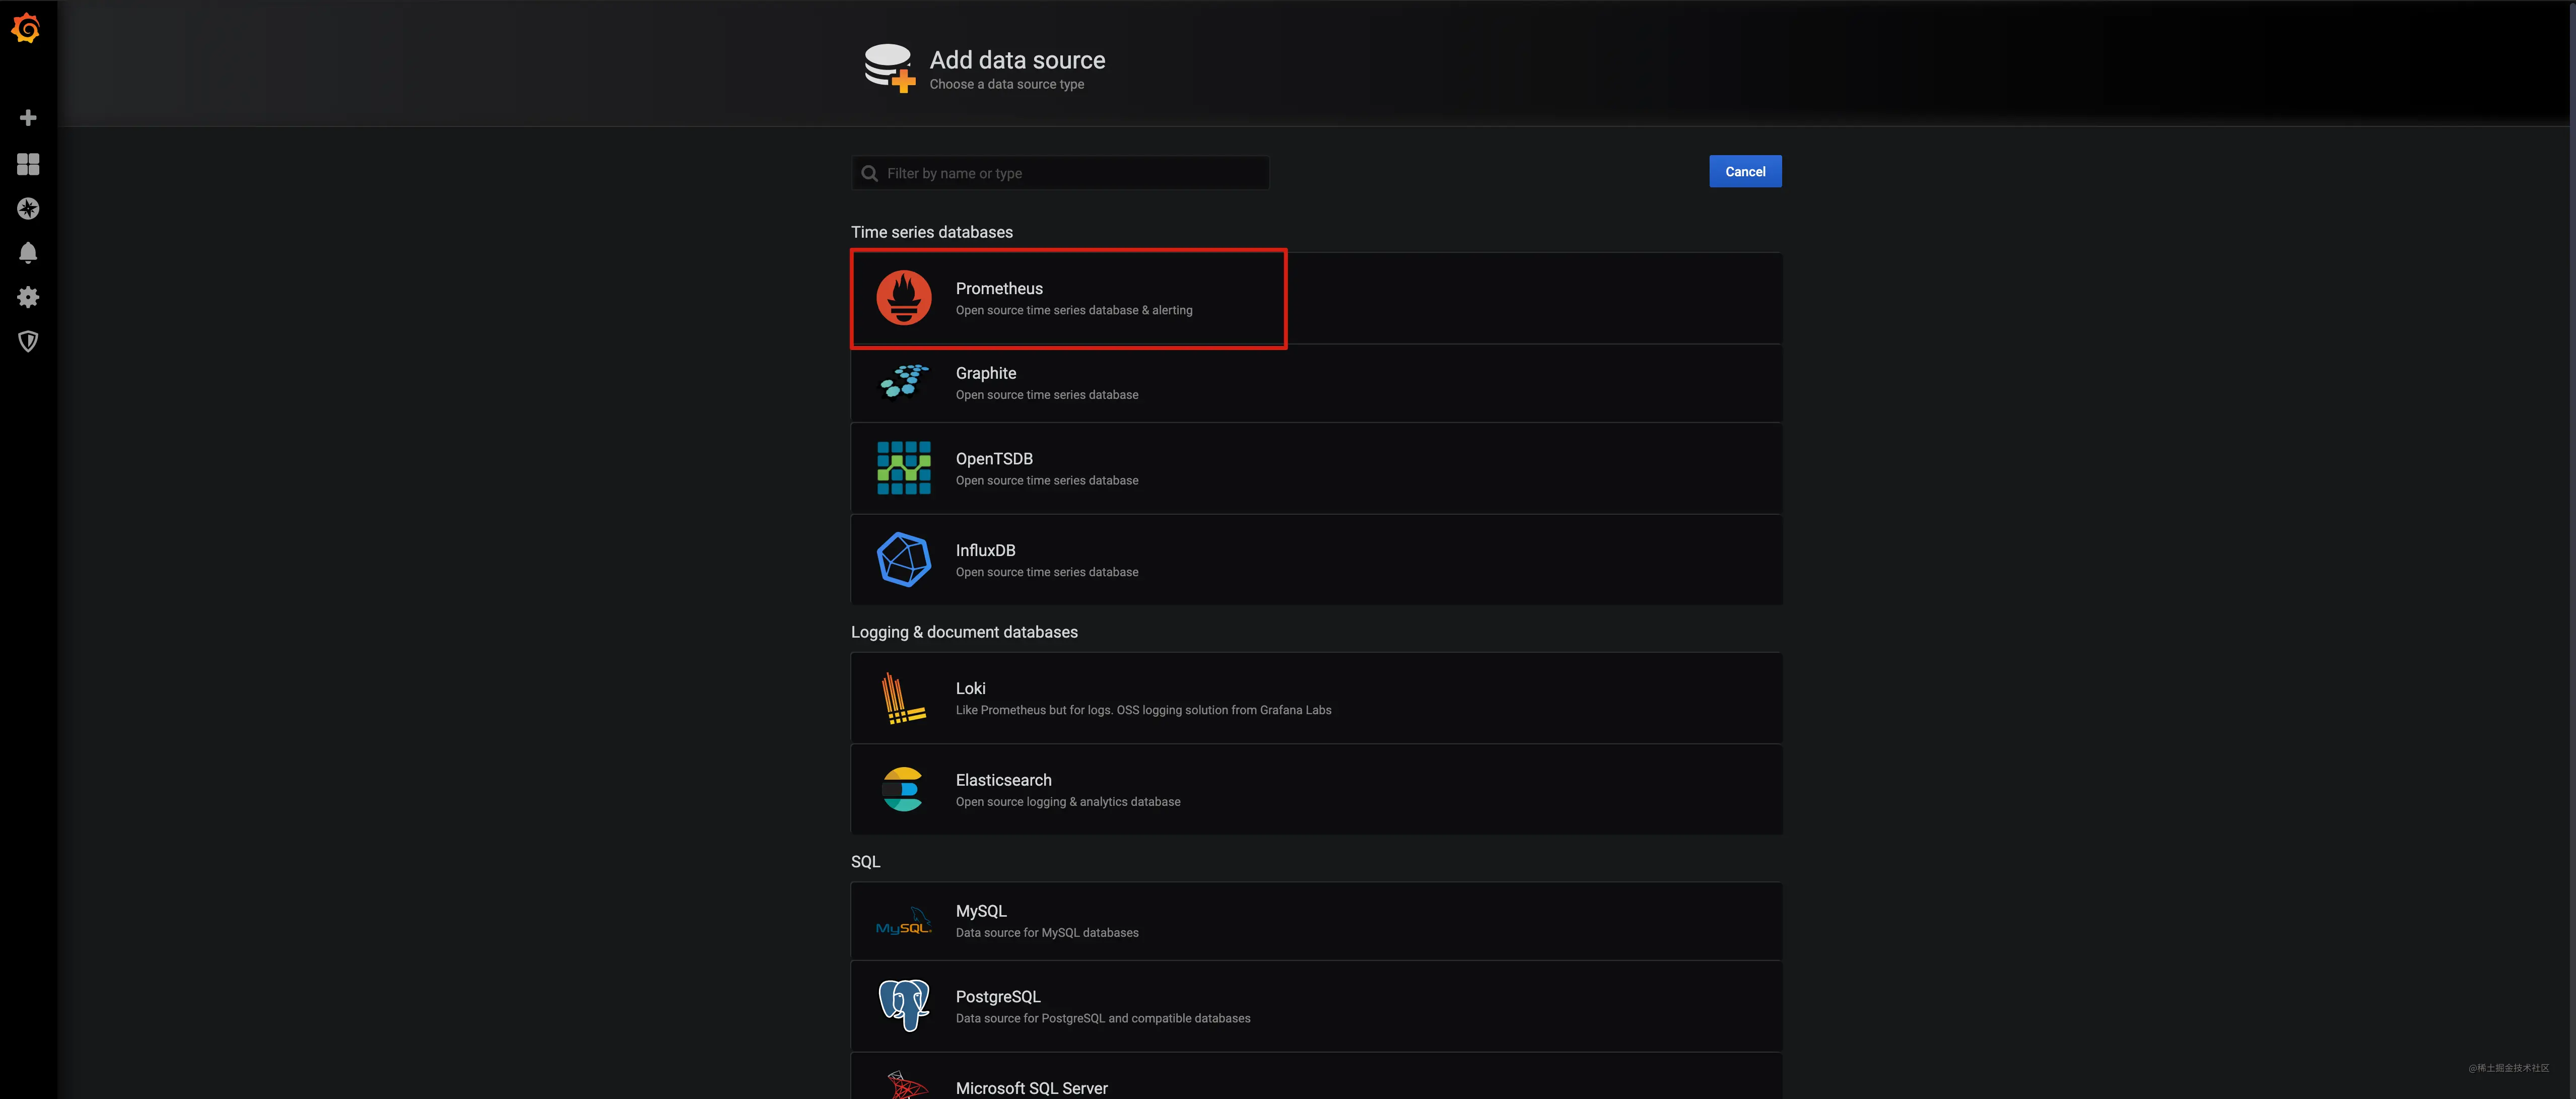
3.3.1 Adding a data source
After logging in, select Add Data Source and choose Prometheus.
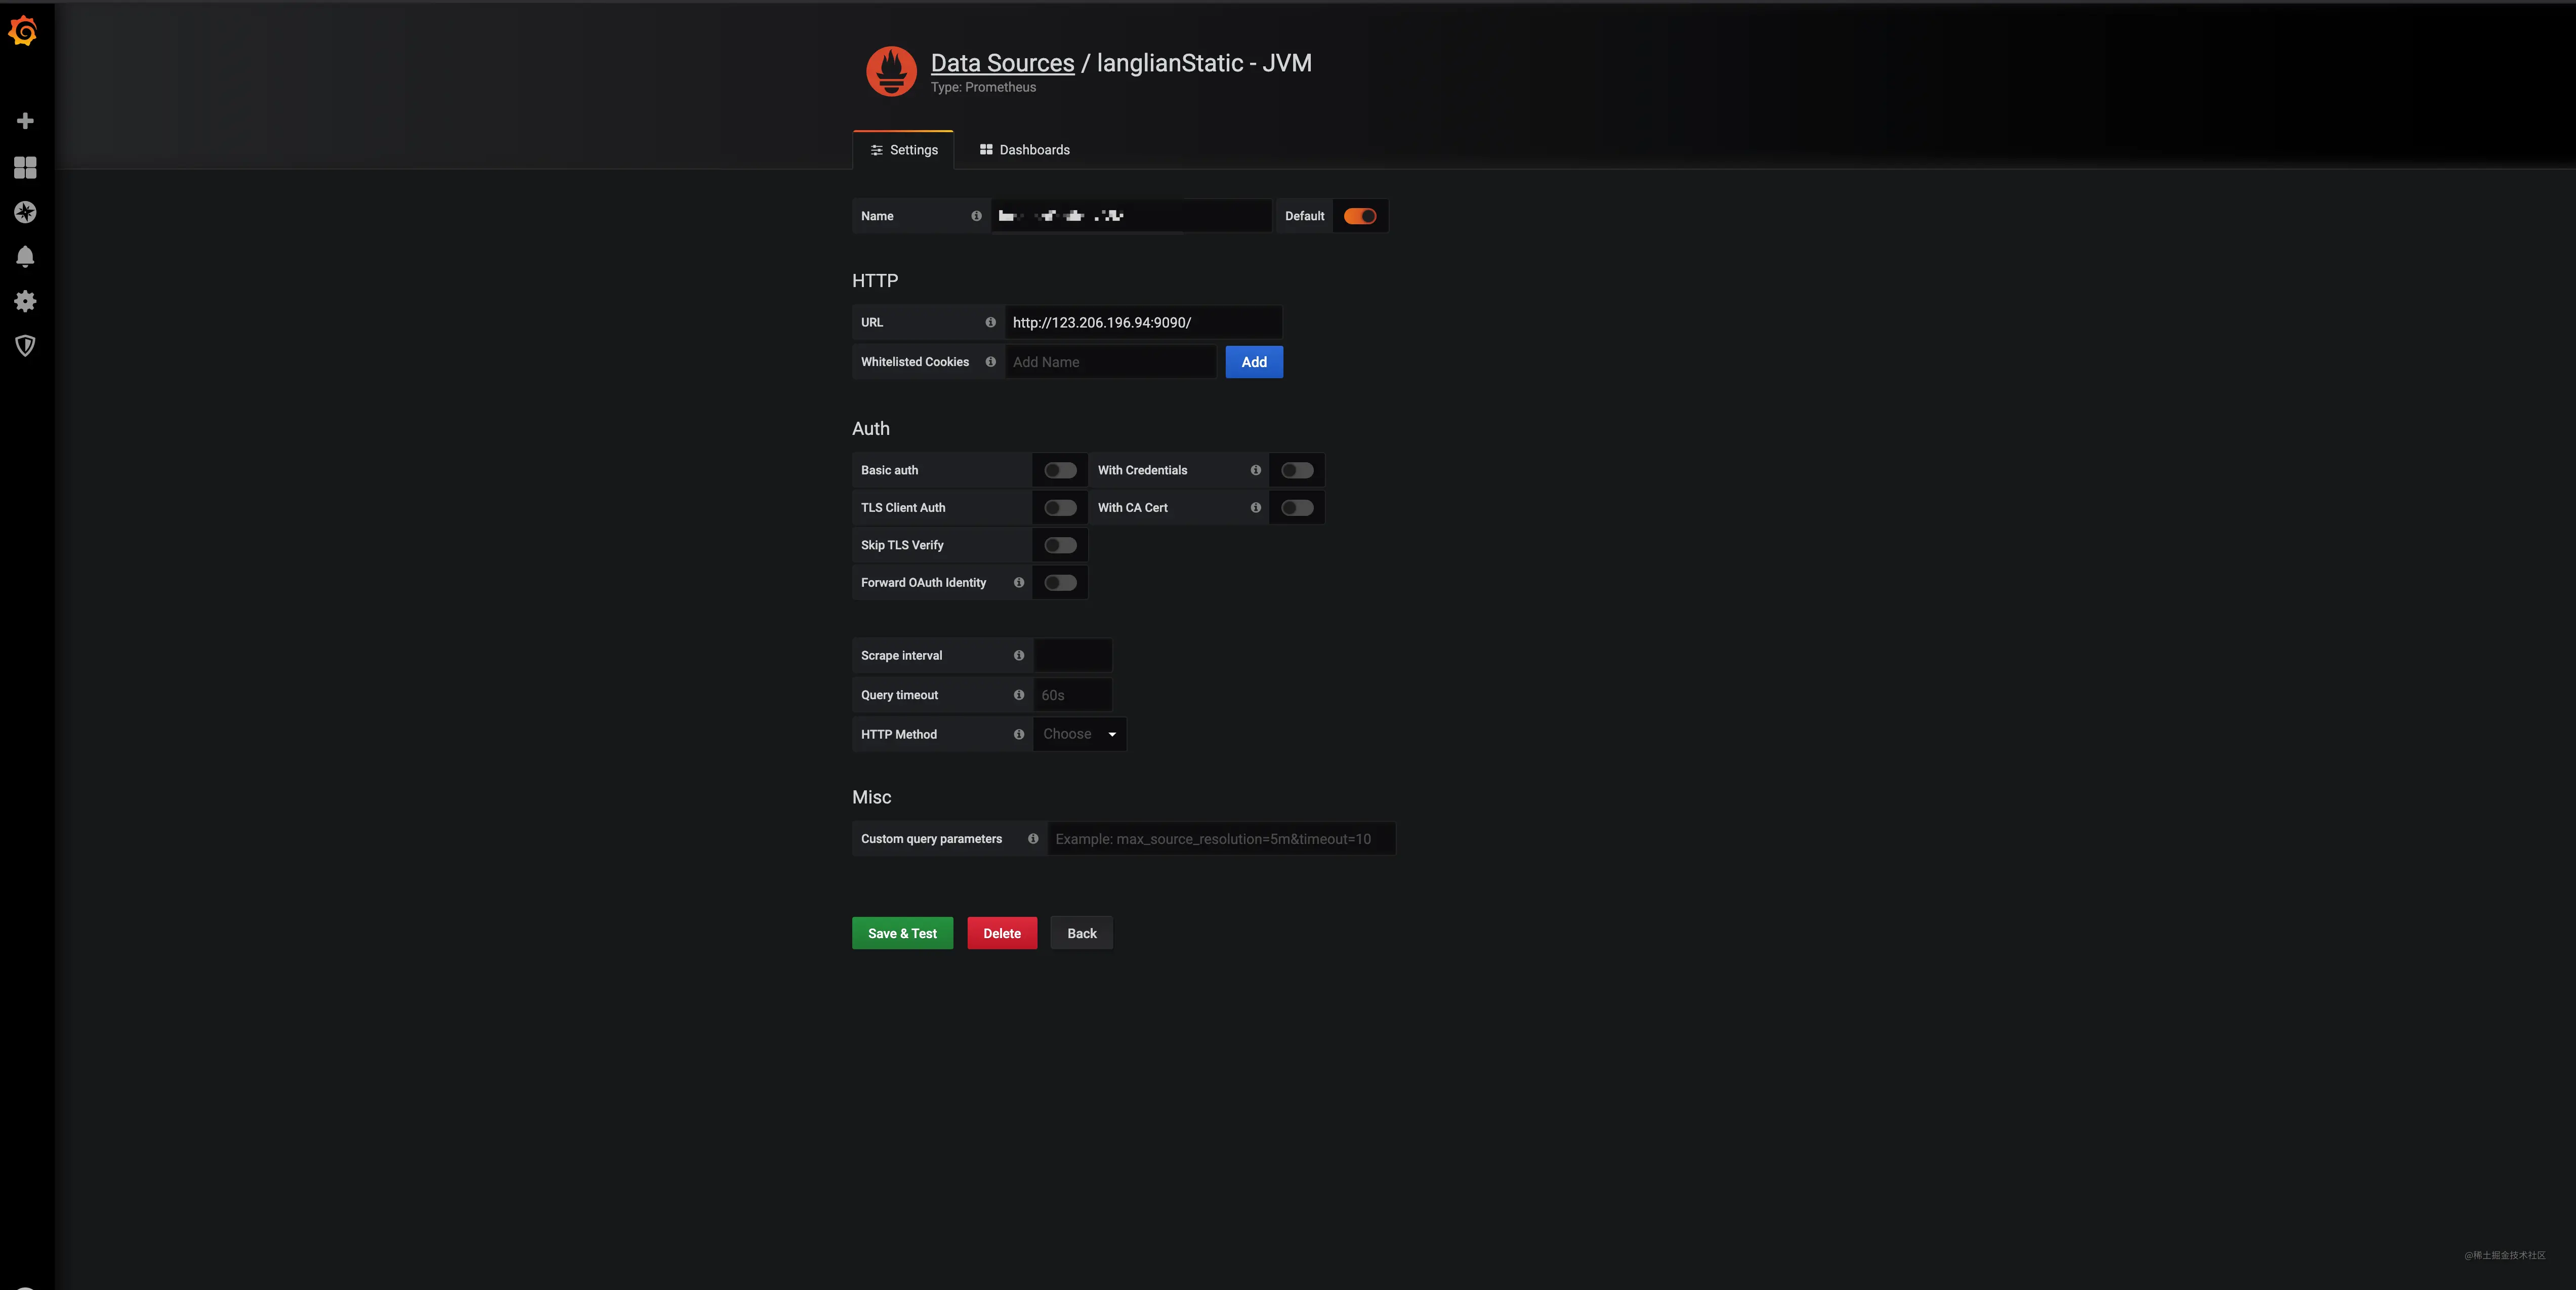
Enter the name of the data source (any), the url address of Prometheus, and click Add to save.
3.3.2 Creating a dashboard
The next step is to create a dashboard, where there are two options, one is to create a new dashboard, choose different components and set the layout, and the other way is to choose a dashboard provided by grafana officially or by the community, and they are all very beautifully styled and can be directly imported. Here we choose to import the dashboard, because we are a Java application, the focus is definitely on JVM related metrics, so we search for JVM and sort by the installed base.
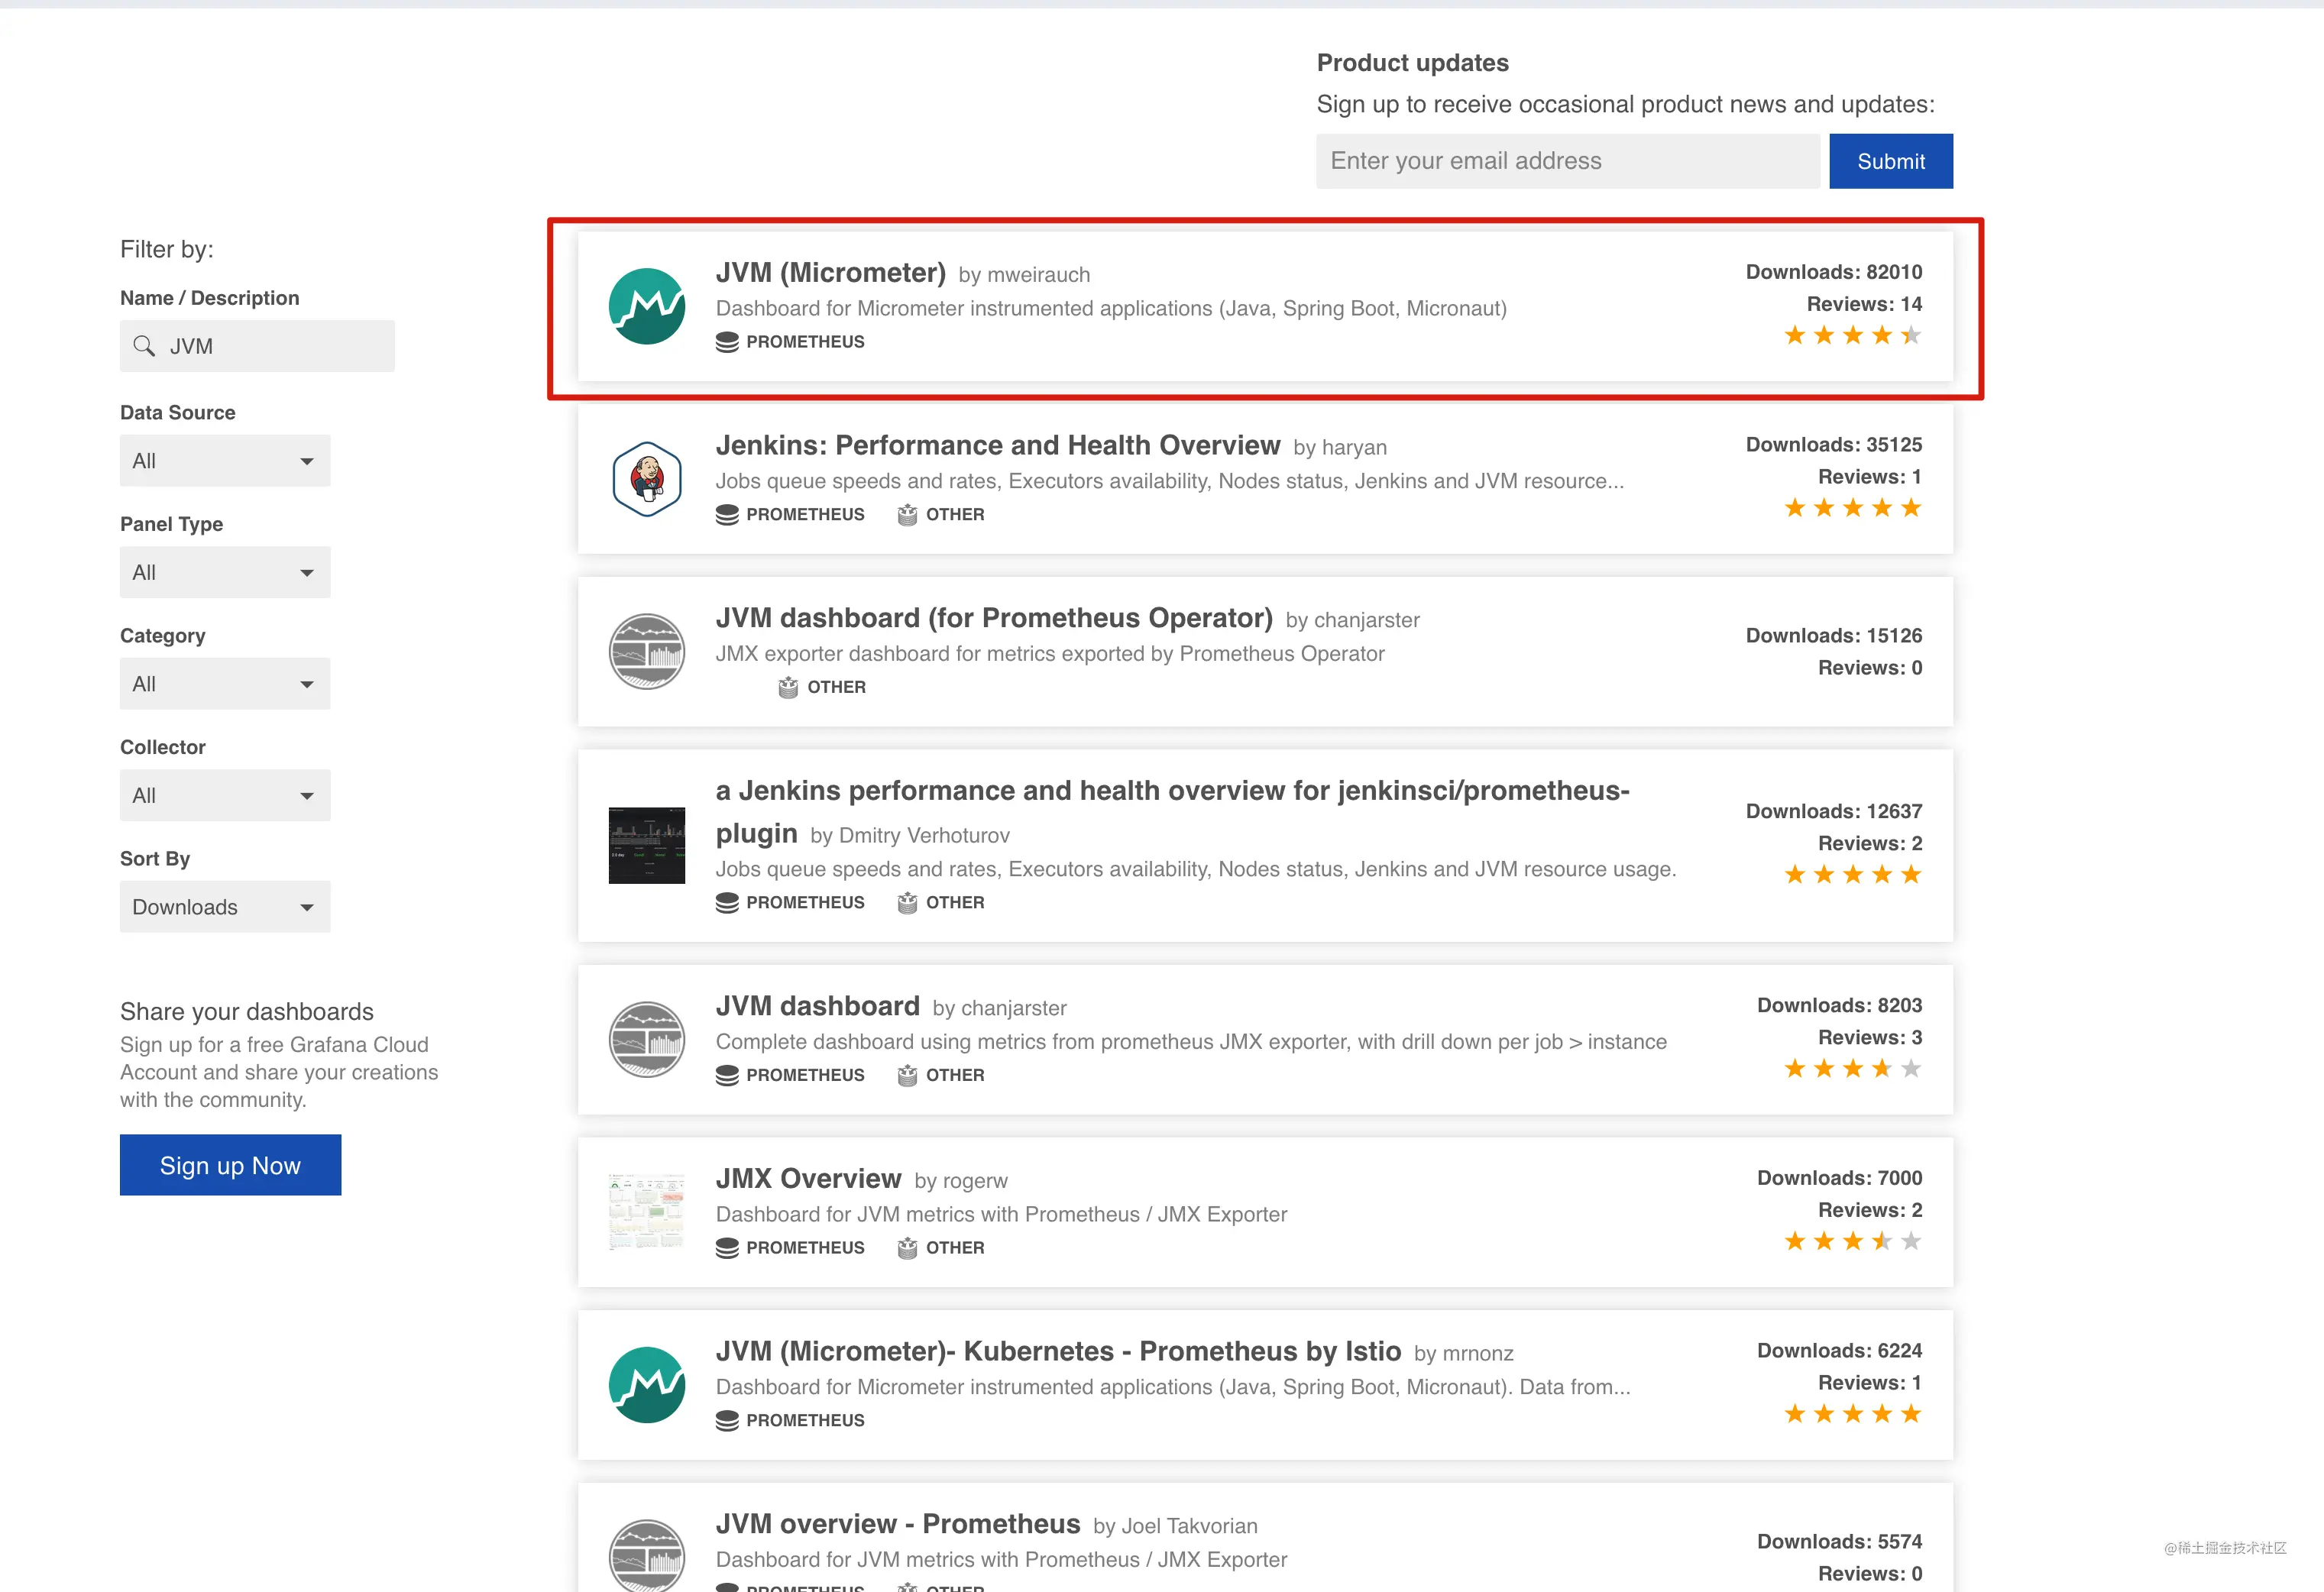
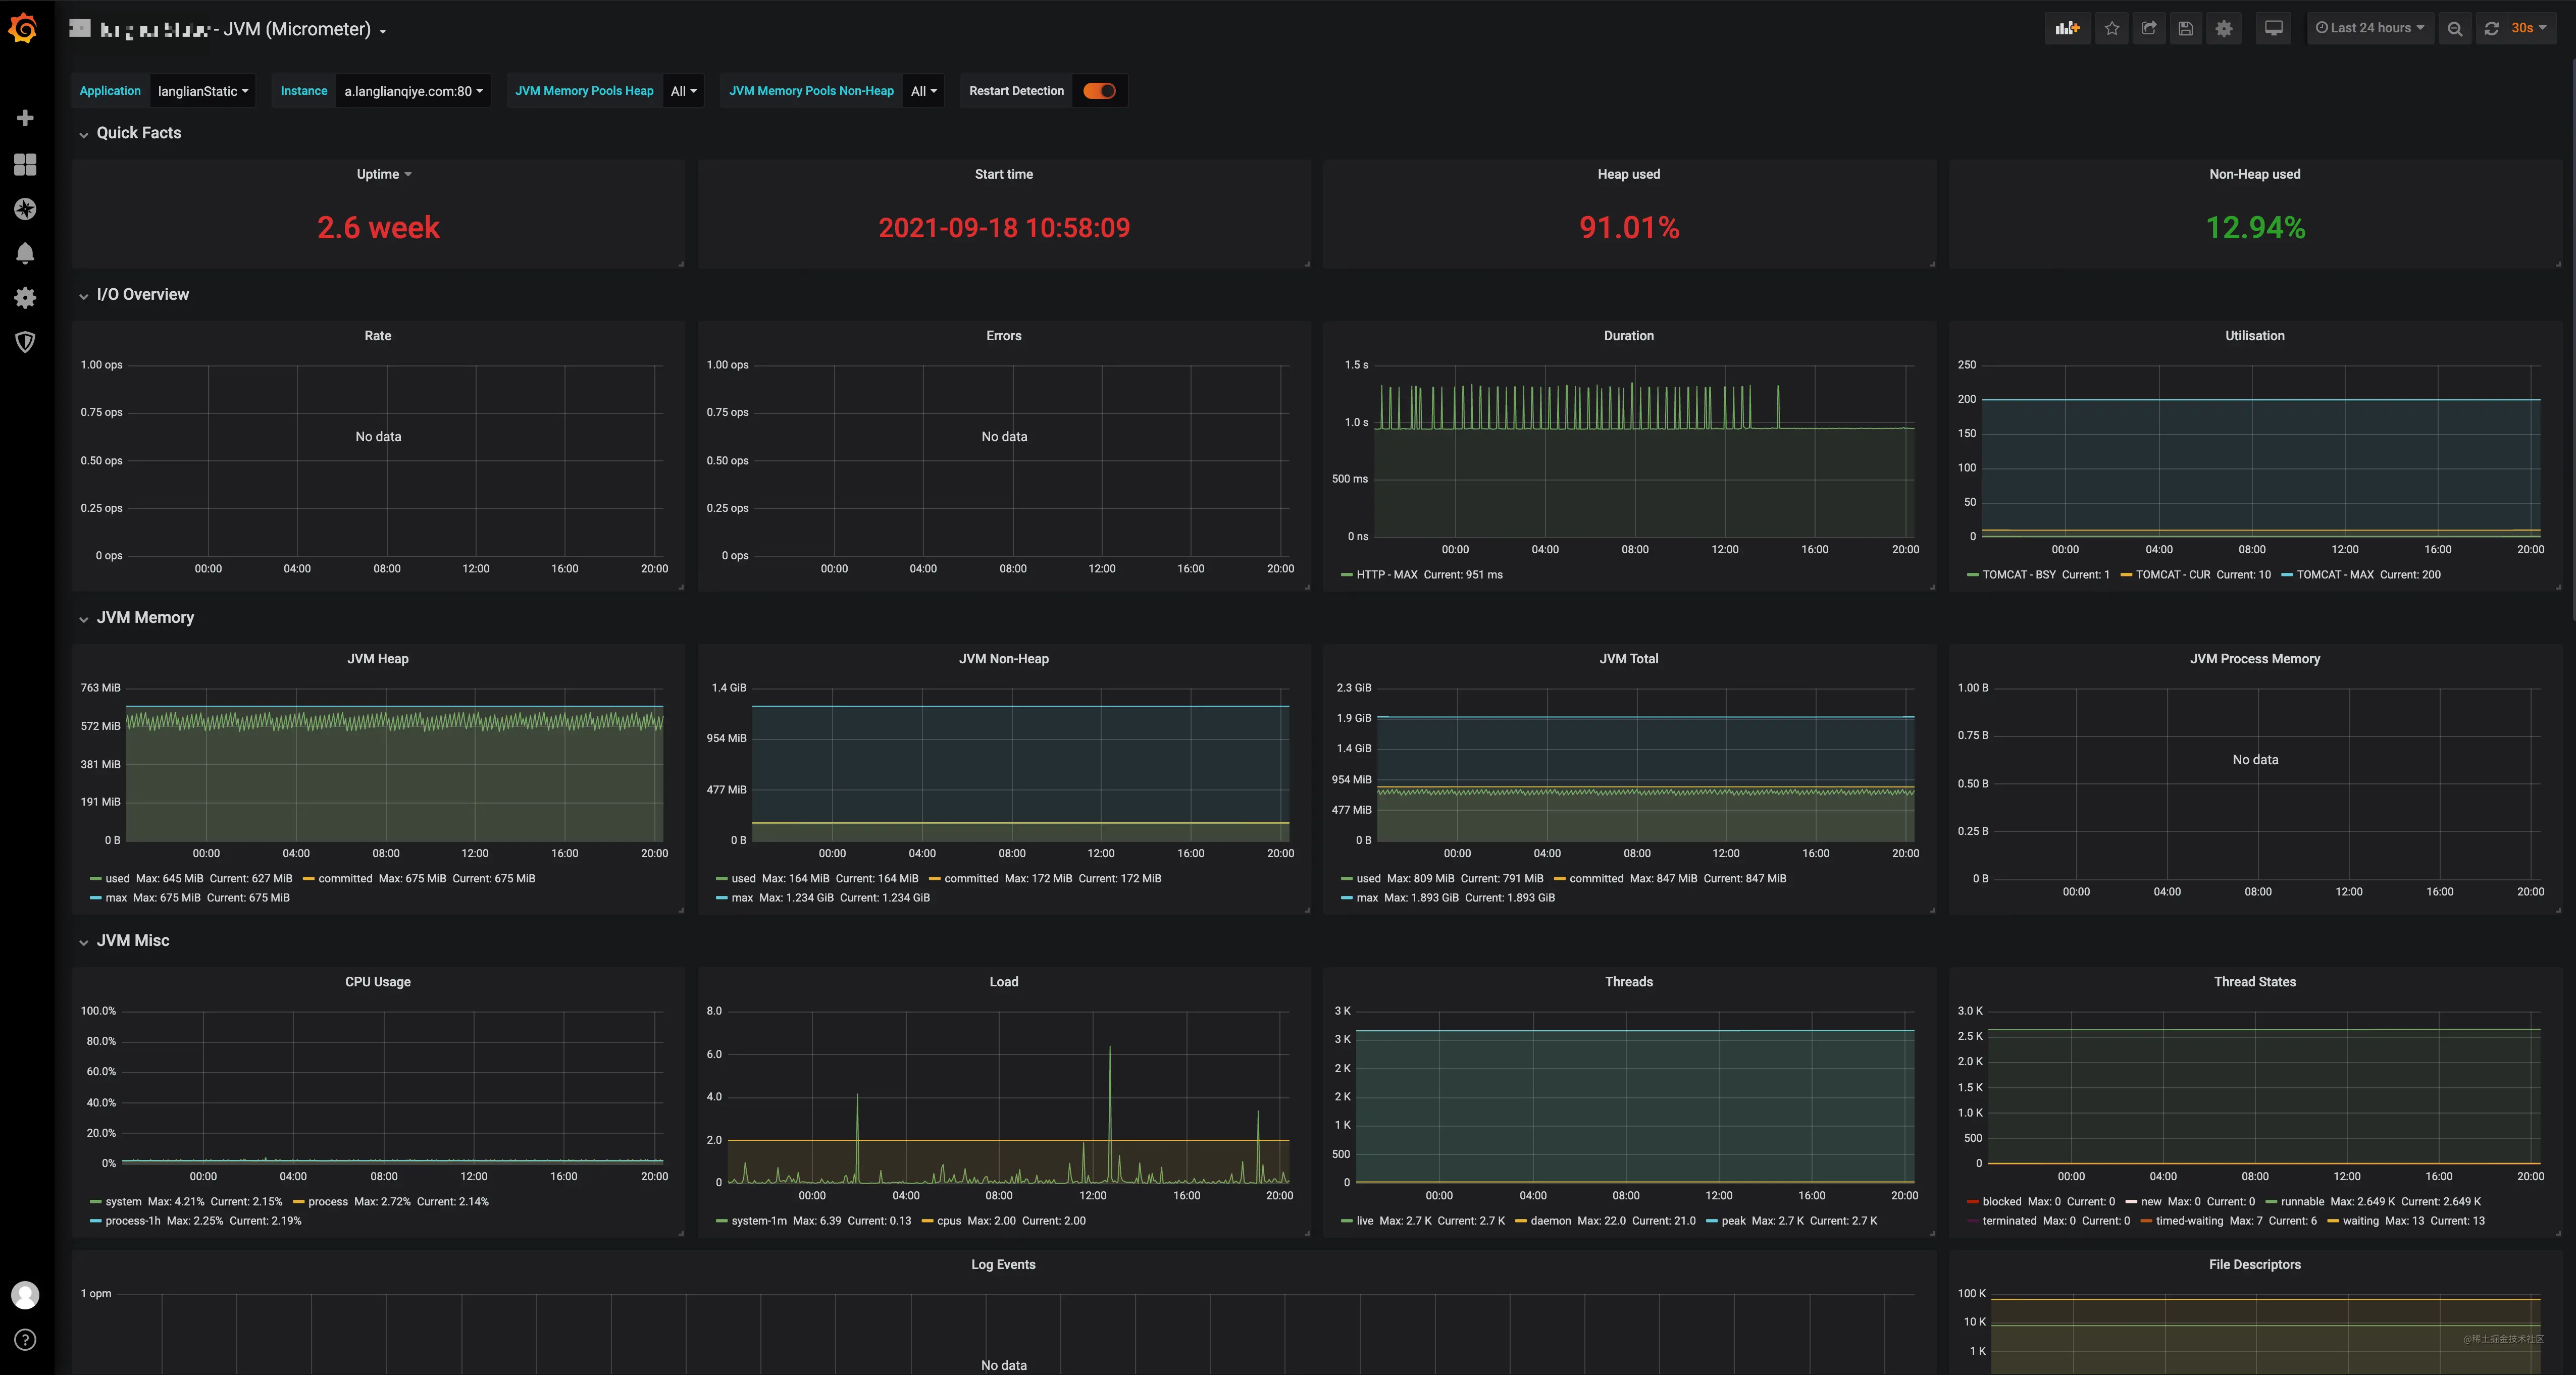
Click on the first one, this dashboard contains JVM, threads, CPU and other metrics, we will import this one, of course you can also choose other dashboards or build your own.
Enter 4701 in the Grafana.com Dashboard.
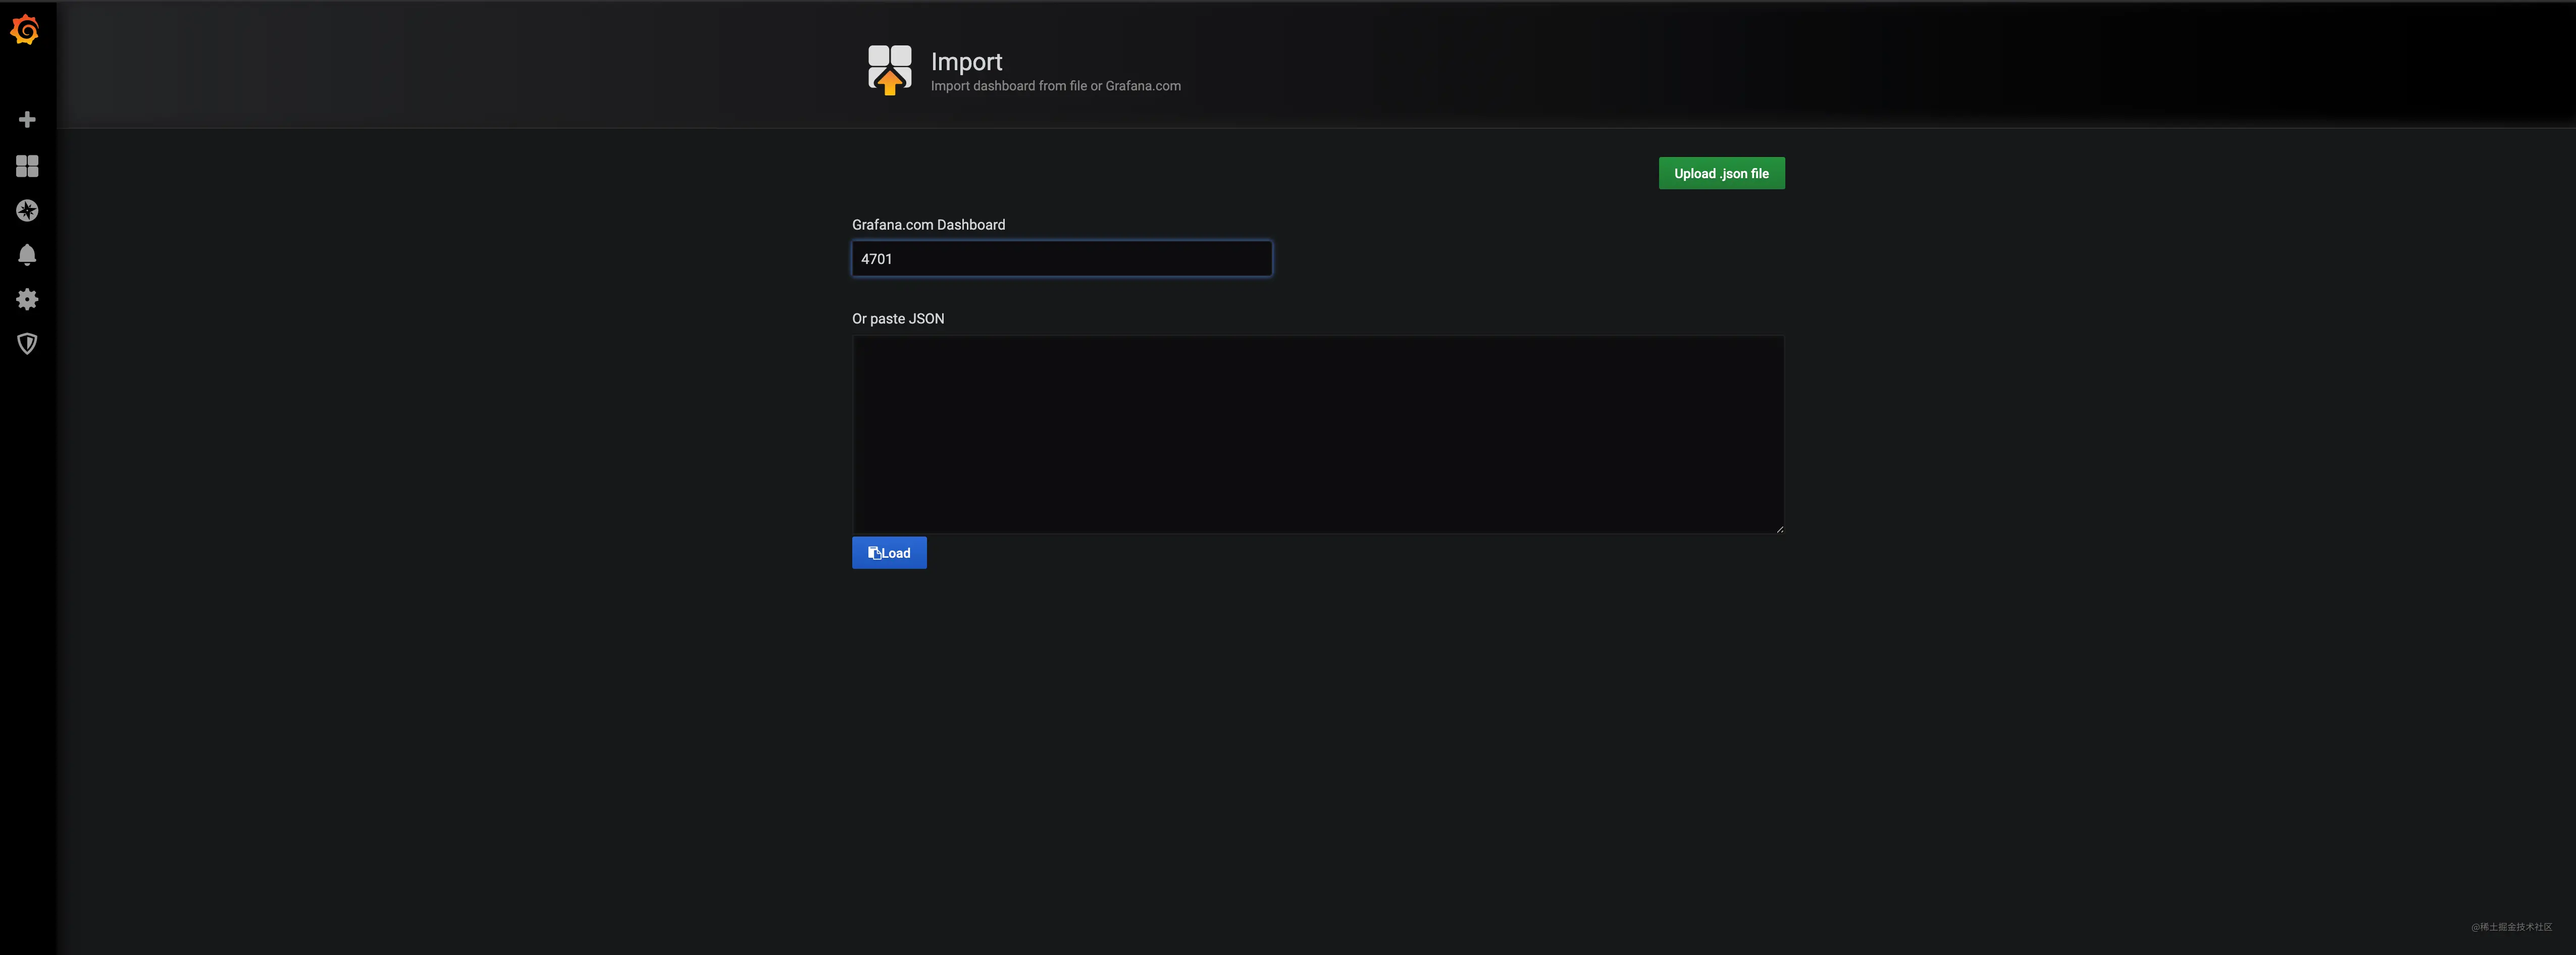
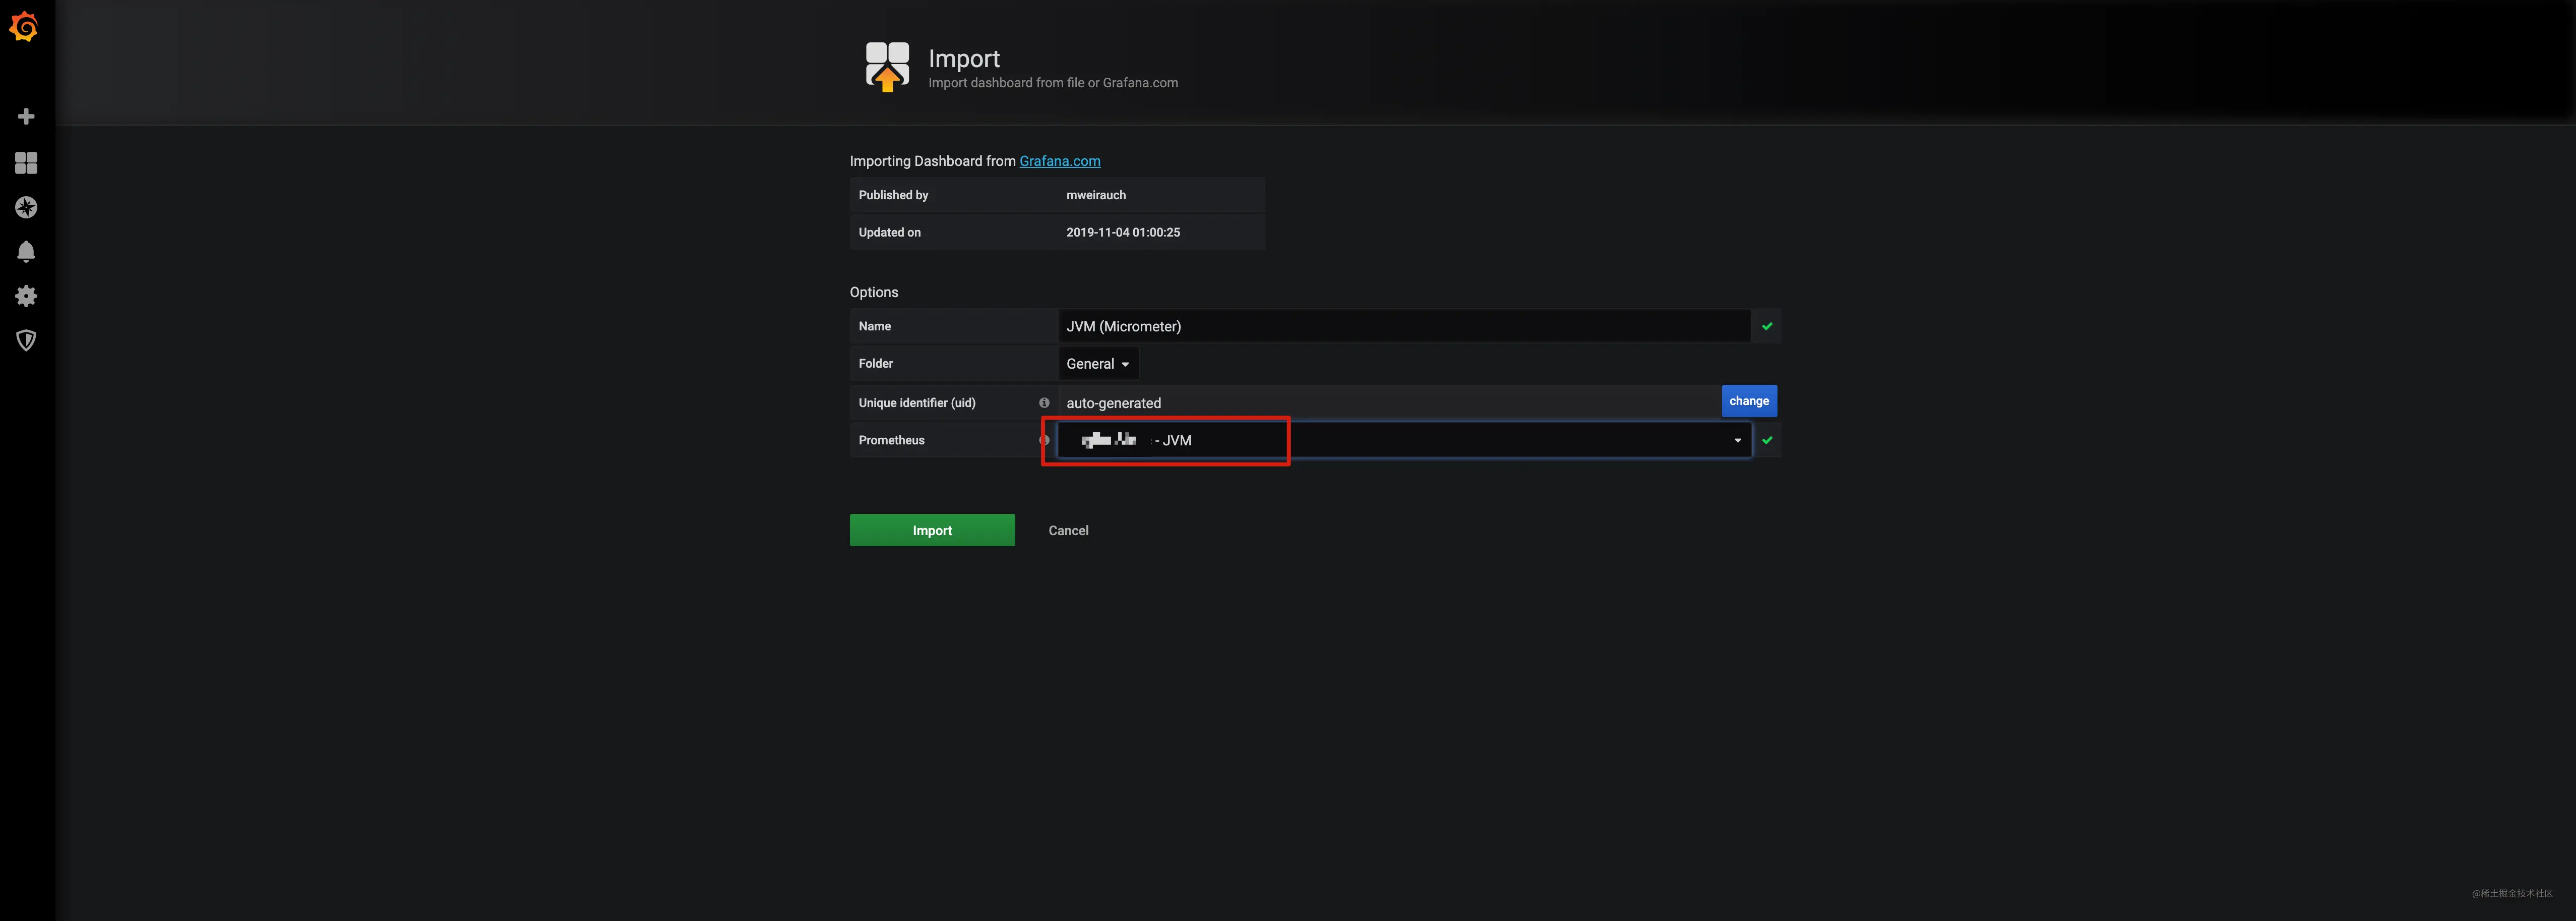
Select the data source and click Import.
The final rendering of the dashboard is as follows.
4. Summary
This article mainly starts with Spring Boot Actuator and introduces Spring Boot application monitoring endpoints and exposure methods, and then takes the endpoint Prometheus as an example and introduces the basic concept of Prometheus and how to use it, Spring Boot Actuator + Prometheus can already complete the visual monitoring application, but Prometheus visualization is still relatively rough, this time Grafana comes out, through Grafana and Prometheus you can achieve a perfect visual dashboard.
In addition to monitoring applications, you can also monitor metrics related to database instances through Grafana and Prometheus.
Reference
https://juejin.cn/post/7015949319425490952