The project is formalized, the logging system is indispensable. The majority of logging platforms recommended to build based on ELK, but ELK is relatively heavy, the architecture is too large, small and medium-sized projects are not very good to hold, I hope to find a simple, if you really can not find then use ELK. before the reserve some technical candidates library, looked through the fruit of a logging system called Loki, but a search is mostly this guy in the movie. I couldn’t help but think, “Is this reliable?

Loki
In fact, the logging system is developed by a reliable team, Grafana Labs, a big name in monitoring, known for open source data visualization tools Grafana, monitoring system Prometheus, etc.
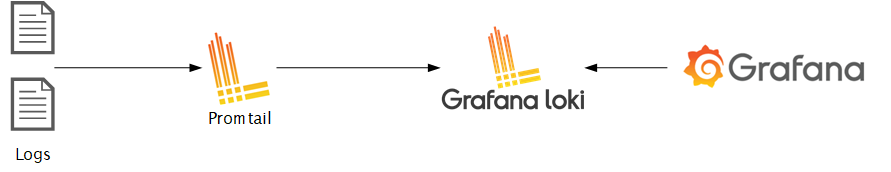
Loki is their open source project inspired by Prometheus, a scalable, highly available, multi-tenant log aggregation system. Designed with the idea of making log aggregation easier, it is designed to be very cost effective and easy to operate. It does not index the contents of logs , but rather a set of tags for each log stream . It consists of three main parts.
- Promtail is the log collector that collects the application’s logs and sends them to Loki.
- Loki is used for log storage and parsing, and provides a query API for downstream presentation.
- Grafana is responsible for visualizing Loki’s logs.
Looks pretty good, I’m going to give it a try.
simply try it
I ran a small DEMO first when I encountered something new, and to be honest, there is no detailed hands-on DEMO for this currently introduced in China, especially the part that interfaces with Spring Boot. I followed the original documentation, and spent a little more than half a day to finally run successfully.
Loki installation
The following is my modified Docker Compose script, according to your own needs to change to start Loki with one click.
|
|
The above mount directories c:/docker/loki and c:/docker/promtail you adjust the location to suit yourself.
Loki configuration
The -config.file=/etc/loki/loki.yml in the above file is the configuration file for Loki, we need to put the configuration file loki.yml under c:/docker/loki in advance, I use the default configuration.
|
|
Don’t get hung up on what these configuration items do, run it first and check the documentation when you need it.
Promtail configuration
Similar to Loki, Promtail should also be configured in the c:/docker/promtail directory of the local mount promtail.yml, and the default configuration is used here.
|
|
I guess /var/log/*log is where the logs are read, so I mounted it locally at c:/docker/log and will get some logs into this local directory and see if I can read them.
Start Loki
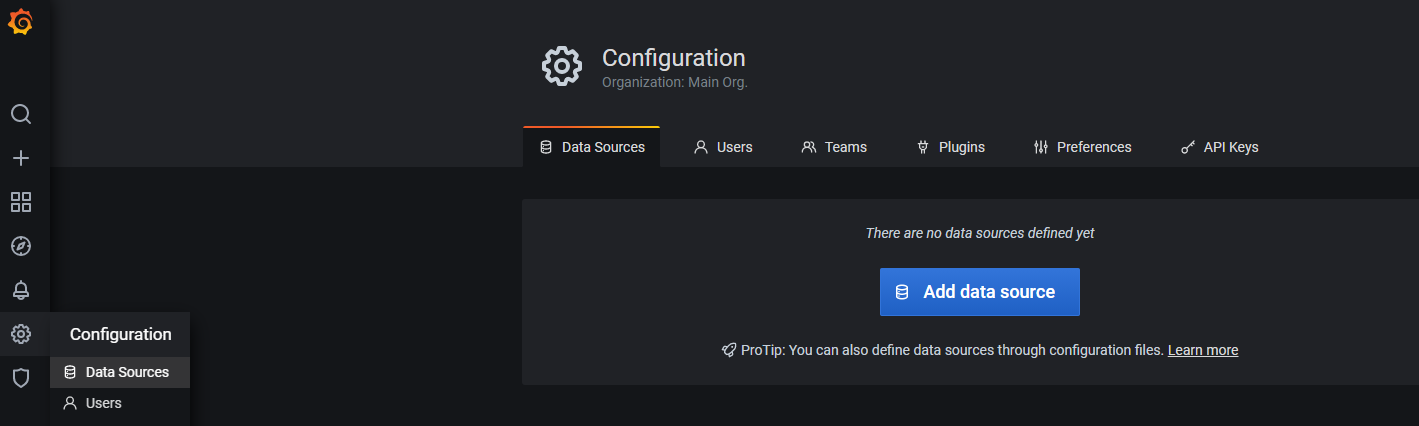
After configuring, execute docker-compose -f <docker-compose.yml path> up command, it will download the image and start three Docker containers first. After success, open http://localhost:3000/ and login to Grafana with the default account password admin/admin. Then add the data source as Loki in the sidebar.
Then configure Loki’s URL as http://loki:3100, then click OK and test, a green prompt means success.
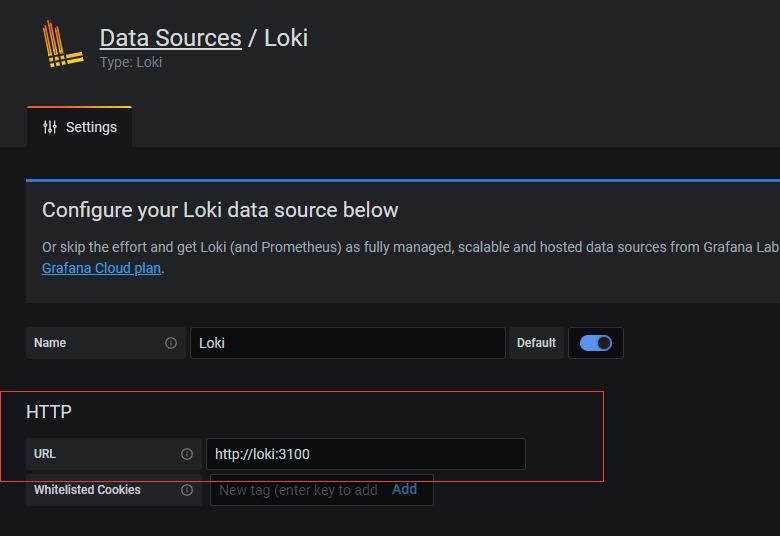
We are using Docker Compose, so
hostnameis the service nameloki.
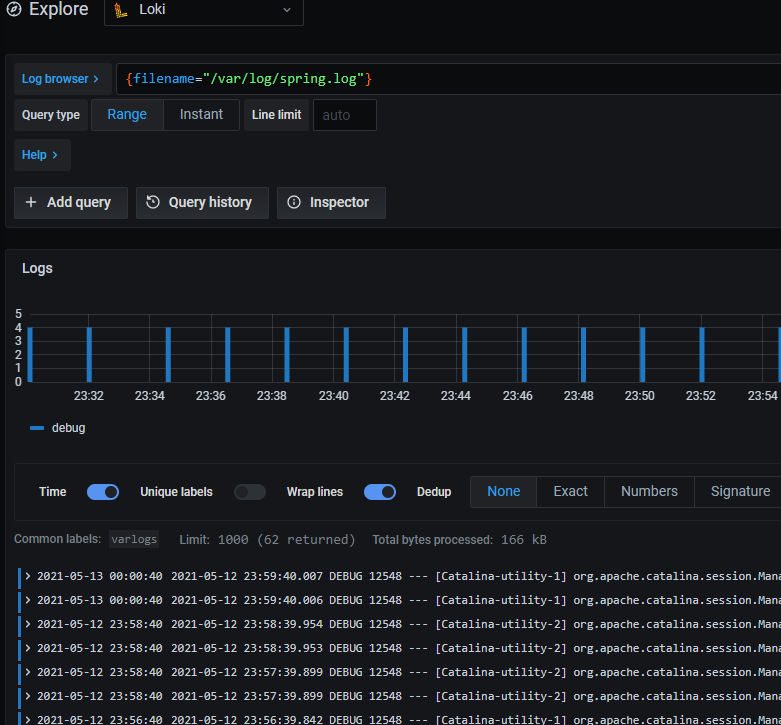
Then click on the compass-shaped icon Explore in the sidebar to enter the logging UI, which is nothing at this point.

You have to create some logs, get a Spring Boot application, then configure the logging options in application.yml and start the application to generate some logs.
Then I entered a Loki query expression from the documentation {filename="/var/log/spring.log"} , and the file name went to c:/docker/log and there it was!
Summary
Today I demoed Spring Boot from scratch against the newest logger Loki, and it looks really good. Learn something new, be clear about its scenarios, be clear about your goals at each step, run up the DEMO, then go into customization, and finally the underlying principles. The more you learn the more skilled you are, the more you learn the more you know your shortcomings, in order to have goals and directions, do not learn blindly, and do not pursue the underlying principles too much. Well, later I will continue to research and explore how Loki in the production environment of the actual use.
Reference
https://felord.cn/loki.html