Last post was a simple introduction to the use of Loki logging platform, and today a simple study of how to use Loki in practice to monitor Spring Boot applications, specially shared to give you a deeper understanding of this new technology.
Loki’s log collection practice
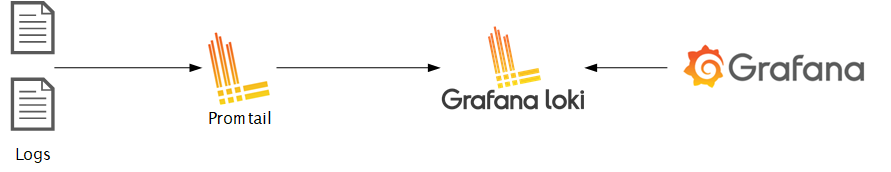
In previous article we used Docker Compose to start Grafana, Loki, and Protail at the same time to monitor an application. And the architecture of the whole logging system.
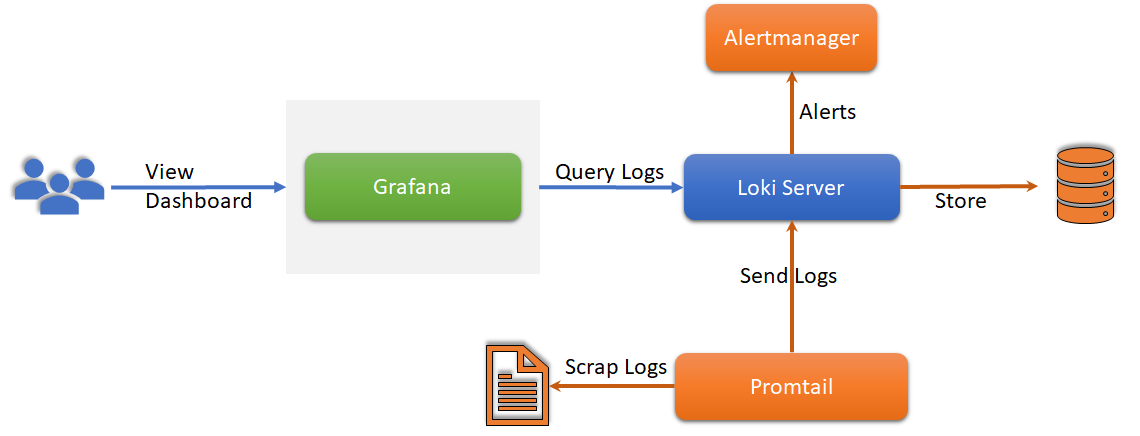
But in practice it is not possible to build a Grafana-Loki-Promtail system for every application.
Promtail Logging Agent
Currently Promtail can track logs from two sources: local log files and systemd logs. What we demonstrated in the last article was the loading of local log files, and this way is the only way I can use it at the moment, the other way is through the service discovery capabilities of K8S.
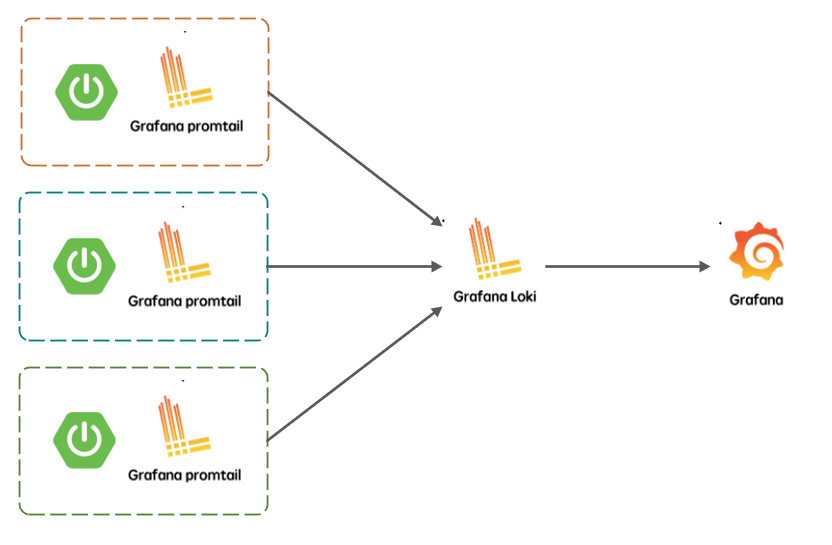
If you deploy multiple Promtail daemons on multiple application servers, you can monitor the static log files of multiple applications and push the logs to Loki for aggregated management via the Loki API.
Promtail dynamic configuration
Grafana and Loki deployments can be found in this post.
We just need to deploy the associated Promtail daemon for the Loki application. Here I’m still using Docker for the Promtail deployment, but I can no longer use the default configuration. The configuration of config.yml should now be.
|
|
In order to build a generic configuration, I’ve made some parameters dynamic. This is a feature available in Loki2.1+, you can use ${} to reference environment variables, and you can even specify a default value of ${VAR:default_value} for them. But you have to know that in order to enable this feature you need to add the option -config.expand-env to the Promtail startup command.
Promtail Docker image transformation
I have modified the Docker image of Promtail according to this, the specific Dockerfile is.
You can build this custom Promtail image with the docker build -t loki-promtail:1.0 . command to build this custom Promtail image. The basic startup command is.
|
|
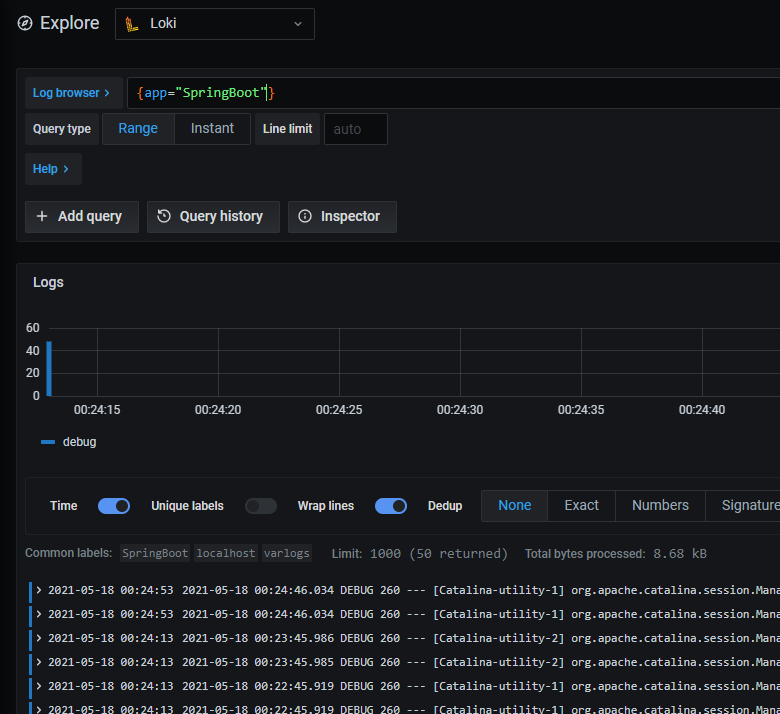
The mounted directory c:/docker/log is still the application’s log directory, and LOKI_HOST has to ensure that it can communicate with the Loki server, whether you are using a direct connection or a Docker network (Docker Bridge is used here). You can use Docker Compose to bundle your application with Promtail, and all Promtail will send the corresponding logs to Loki for centralized management. In addition, with the custom Label we can search for logs by application name.
Summary
Today we have shared the mechanics of Loki log collection in a more hands-on way, especially the modification of the log collector Promtail for deployment. Hopefully, this will help you get a quicker hands-on with this logging nouveau riche.
Reference
https://felord.cn/promtail-custom.html