Remote debugging techniques, which are relatively common in development. If the technical team is using DevOps-based development process, then you may need to understand remote debugging techniques.
In our company, back-end development engineers, hardly ever start services locally for debugging. In some cases, unit tests and interface tests are not good enough to recover and track the weird bugs, and we have 2 internal environments (development and testing environments), which are developed locally, then the code is pushed to the “development environment” server and deployed automatically via CI/CD, and then debugged based on the development environment. The development environment is debugged, and then remote debugging comes in handy.
After the development environment is complete, we merge the code and push it to the test environment and deploy it in the same way. At this point, the testers will test the application. Imagine that after testing a bug, the testers usually have to report some text. For example, the interface address, request parameters, which conditions can trigger the bug, the destructive and impact surface brought by the bug, etc.. Then the developer will restore the scenario according to these situations and track the bug, the efficiency is not discussed for the moment, the problem here is that you are not necessarily able to reproduce it, usually need to go through some complex business processes. At this point, you can trace it step by step by using remote debugging and starting breakpoints in suspicious places.
Java Debugging Technology JPDA
JPDA, the full name is Java Platform Debugger Architecture.
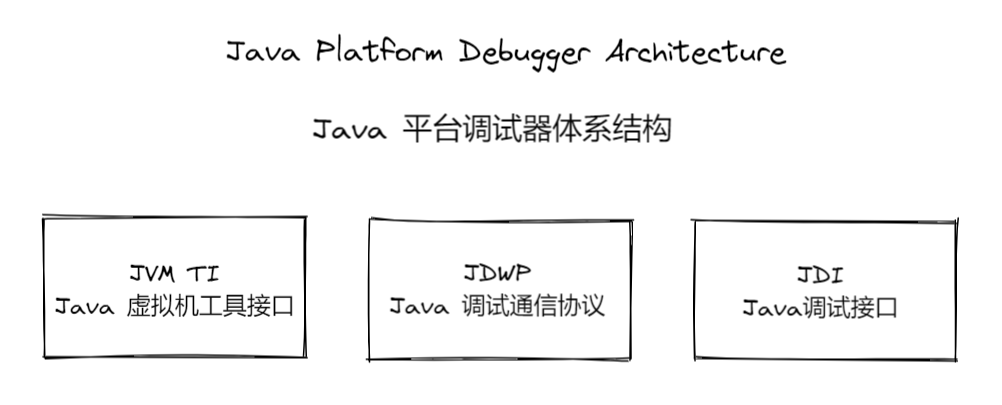
- The JVM TI Java Virtual Machine Tool Interface is a two-way interface that supports communication between the JVM and native agent programs. It replaces the JVM DI and JVM PI interfaces. We usually set breakpoints in IDEA to stop the program, but if we want to implement it remotely, then the JVM has to provide a proxy mechanism for managing the various types of information required by the JVM. JVM TI supports all tools that need access to the JVM state, including but not limited to: analysis, debugging, monitoring, thread analysis, and coverage analysis tools.
- The JDWP Java Debug Wire Protocol is a communication protocol that is part of the Java Platform Debugger Architecture. It is used to communicate between the debugger and the Java virtual machine it is debugging. It allows debugging processes on different computers. It can work over network sockets or shared memory. To put it simply, if you want to communicate with the JVM TI Agent, you have to communicate with the “communication backend” first, so don’t we need a protocol to communicate? Yes, it is JDWP.
- JDI Java Debugger Interface defines a high-level Java language interface that developers can easily use to write remote debugger application tools.JDI is located at the top-level entry point of JPDA and its implementation is written in JAVA language. So it can be understood as a wrapper call to the JDI interface by the Java debugging client to start debugging.
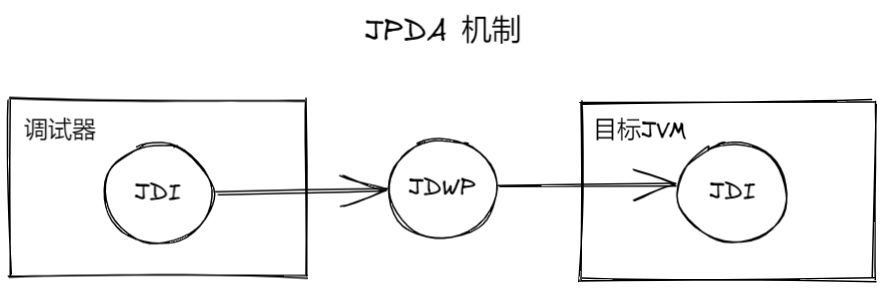
Let’s sort out the whole debugging process.
IDEA Client Debugger -> JDI Client -> JDWP Agent -> JVM TI Agent -> JVM TI -> JVM Application
I won’t waste space on the deeper principles here (in fact, it’s a little hard to understand). The key for us is to use this thing well, in order to simplify the development, right?
Remote debugging in IDEA
First of all, there are many kinds of JPDA method, we only talk about the most frequently used one here, that is, debugging springboot project on remote server in idea, of course, other projects are also possible.
Setting up the application
There are generally no restrictions on how the application can be run, but we usually package the application as a jar package and launch it using the command line, which is actually the case in the container. I’ll use a JDK 8 project as an example below, but of course I’ll point out the differences between versions.
|
|
Note that there is no difference between here and our normal application startup, we just need to add the VM option to start the application using the debug agent.
- address This parameter may be a bit ambiguous, it is for configuring the port, but in some cases it may be
*:5005or0.0.0.0:5005. - server=y This is to specify whether the current application is used as a server or client for debugging, the default is
n, which means client, but we must use it as a server, so we have to change it toy. - suspend This parameter specifies whether the process will wait until the debugger is connected and then run, or start immediately.
- timeout is also the timeout time in milliseconds. When
suspend=y, the value indicates a timeout waiting for a connection; whensuspend=n, the value indicates a timeout for use after a connection.
Setting up IDEA client
We open the idea client, find Edit Configurations, then select + to add a new Remote JVM Debug and install the configuration in the way shown below.
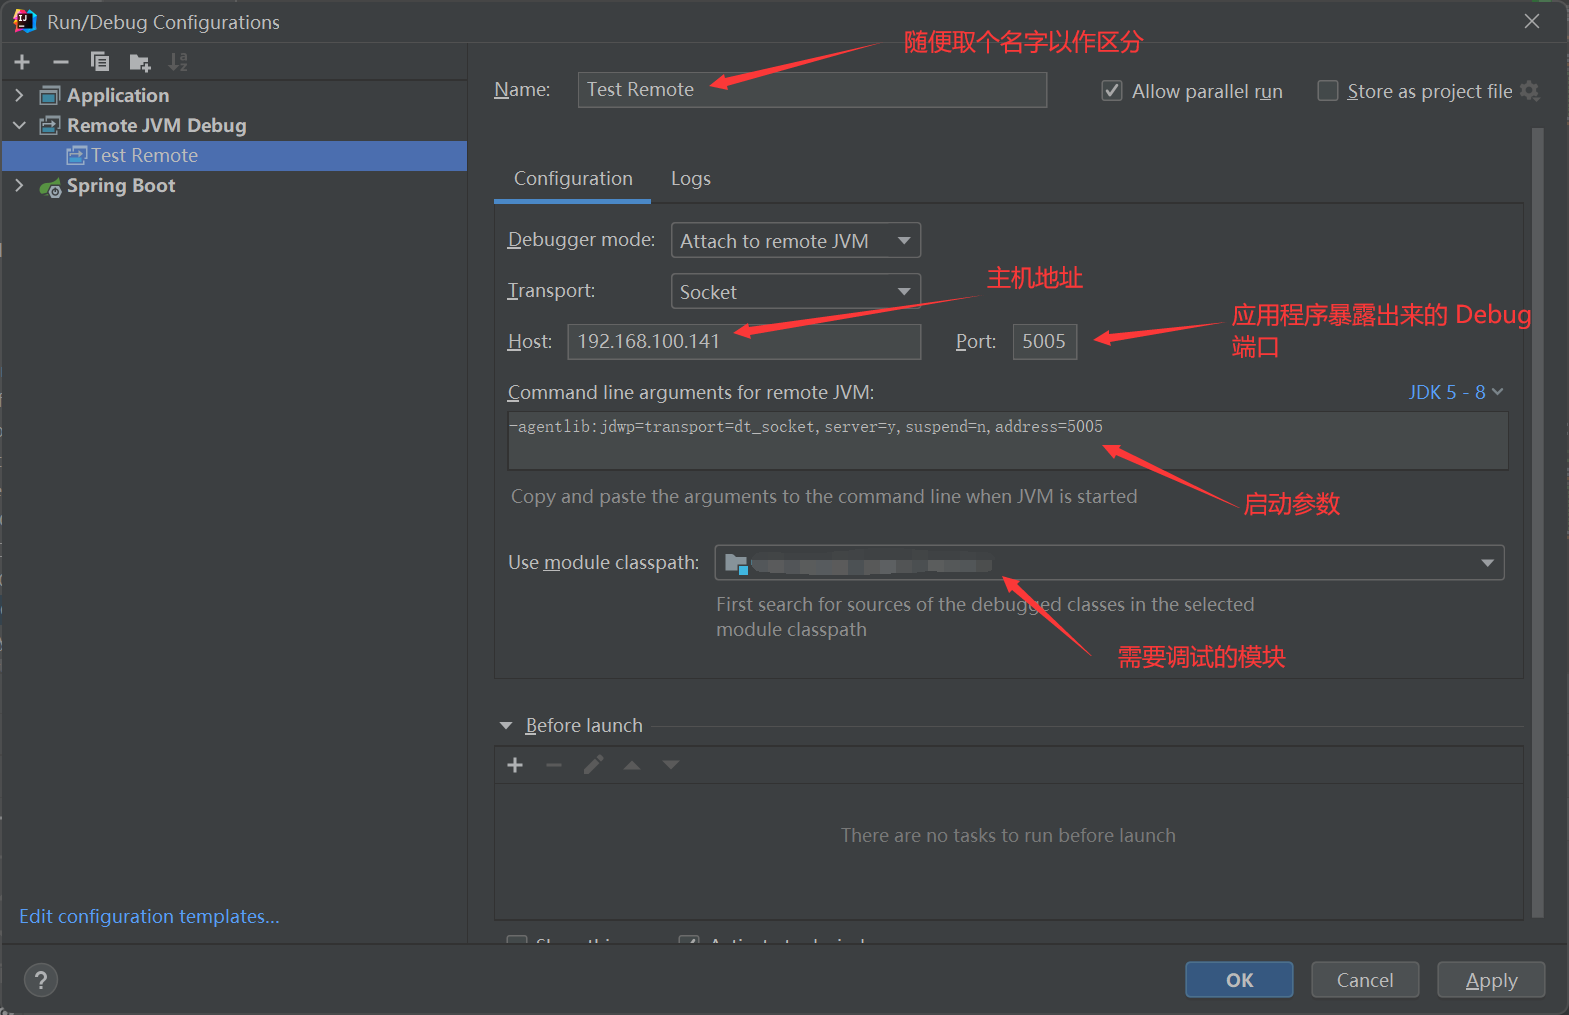
Please note that the ip, port and project module, remember to fill in your own! If you are running on the same machine, you need to fill in localhost.
After the configuration is complete and the remote application is started, we start the local application we just configured and, not surprisingly, you will get the following line of output.
|
|
After connecting successfully, try setting a breakpoint on your idea to debug it.
Differences between versions
If you have read the documentation, you may have noticed that the configuration varies slightly from one JDK version to another.
-
For JDK 1.3 and older versions
1-Xnoagent -Djava.compiler=NONE -Xdebug -Xrunjdwp:transport=dt_socket,server=y,suspend=n,address=5005 -
For JDK version 1.4
1-Xdebug -Xrunjdwp:transport=dt_socket,server=y,suspend=n,address=5005 -
For JDK versions 1.5 - 1.8
1-agentlib:jdwp=transport=dt_socket,server=y,suspend=n,address=5005 -
For JDK 1.9 and later
1-agentlib:jdwp=transport=dt_socket,server=y,suspend=n,address=*:5005
Cautions
- Make sure that the code of the remote application and the local idea debugger are consistent, otherwise there will be many weird phenomena!
- The module must be the same on both sides. For example, a microservice project where you start service-a remotely, but service-b locally, will not work!
- Be careful to open the corresponding ports, and always pay attention to the Debug port and the program port, they are two different ports, do not conflict.
- between different applications, do not share a Debug port, or what will happen, I have not tried ~
- If you deploy in containers, or k8s, pay attention to do a port mapping, such as Docker need to add
-p 5005:5005.
Reference https://blog.besscroft.com/articles/2022/remote-debugging-spring-boot-application/